I recently joined a roundtable discussion at the Metrics Store Summit with three business intelligence (BI) entrepreneurs (and good friends). We dived into our approaches in this space, the architecture of our products, the technical aspects to how different data structures work, and how these solutions help make data usable for everyone in an organization.
The entrepreneurs I spoke with were Nick Handel, CEO of Transform, and Artyom “Art” Keydunov, Founder of Cube Dev. Keenan Rice, General Manager at Firebolt, moderated.
It was a great discussion. Here are some of the points we covered:
What are the most important elements in defining a data model for analytics?
Keenan Rice began the conversation with some useful context about the evolution of semantic layers and metrics: “Semantic layers have been around since the days of the first generation of BI, and even before that, the idea of how you define a metric in an organization has been around since a company [was] born,” Rice said. “How do you define revenue, how do you define margins? There’s nothing new but it’s cool to see how the generations have evolved and all the external factors have evolved.”
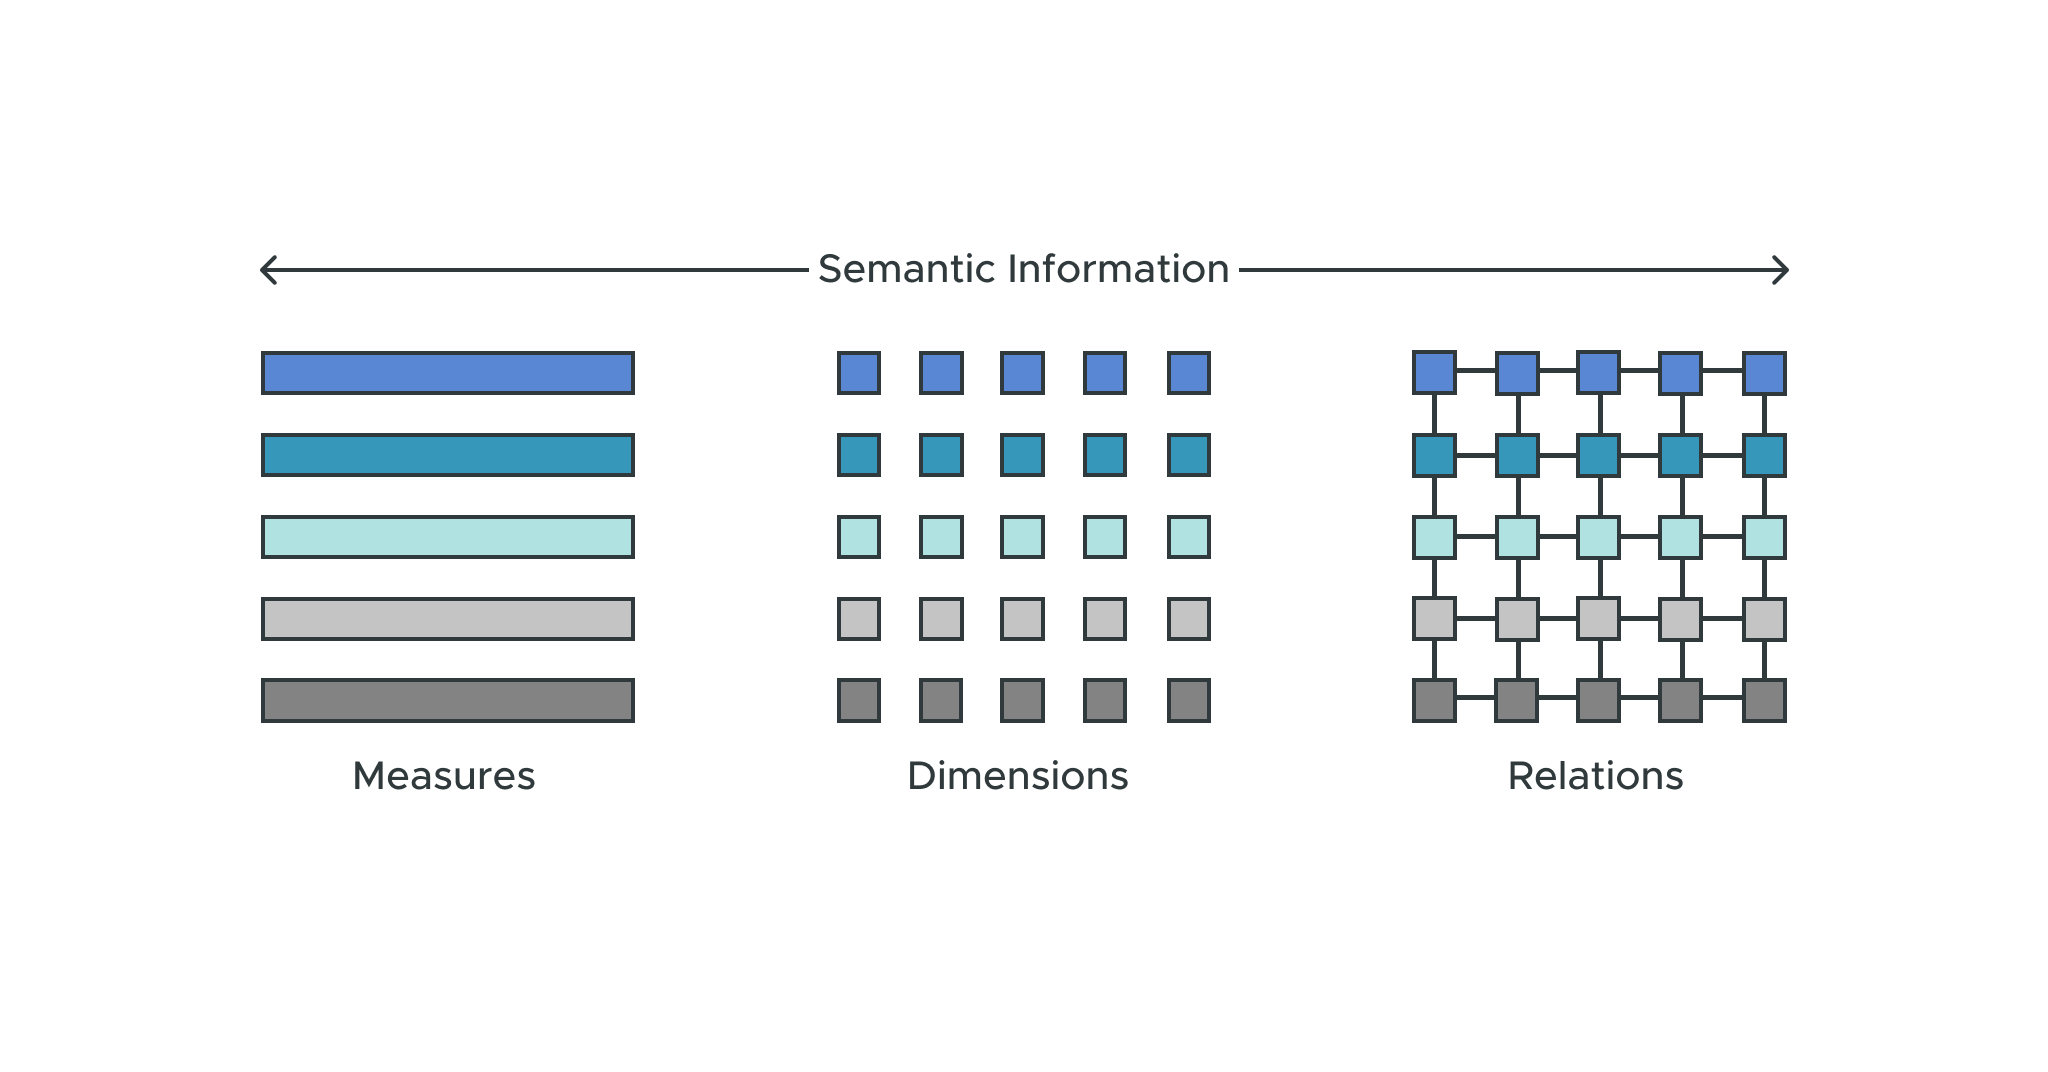
Nick Handle and Art Keydunov agreed that semantics are the most important element in a data model. “You need to capture semantic information — measures, dimensions, relations,” Nick explained. “What are these data assets, and what do they mean? Nothing is possible without good, clean, semantic abstractions.”
Shareability and reuse also need to be considered. You could have a finance team that controls finance models and a shipping team that controls shipping models, but if you want to see how much shipping is costing you have to put those finance and shipping models together.
You also need conformed dimensions, a single time dimension, and a product catalog. Somebody needs to own those. You need them to create new mash-ups, new views of the business. So it’s important not just to document those metrics; you also need to be able to share and mash them up.
Why should metric layers exist as independent products?
You can’t have a single source of truth if you have multiple semantic layers. If everybody is using a different tool, then no one trusts the data coming out of those different systems. The semantic layer needs to be distinct from the consumption layer.
It also needs to be distinct from the data platform. I see a lot of DIY projects building database views with a medallion architecture. If you have more than one data platform, you have that same problem of not having a single source of truth.
Keydunov believes that keeping the data model inside downstream tools leads to a lot of duplication and inconsistency. Handle goes on to say that smaller and mid-sized organizations historically had a monolithic BI platform, but they’re starting to figure out they don’t want their semantic layer and BI tool wrapped up in one tool.
When AtScale was seeking funding in 2013, the preferred approach to BI was to have everything in one stack. That’s what people were buying. But as a user you want choice. You can’t force a user to change their habits. Instead, give them access to data and let them use it with the tools they know and love.
In your mind, do you differentiate between a metric store versus a metric layer?
Keydunov uses these terms mostly interchangeably, but he differentiates headless BI, which has a metrics layer and a serving layer. The serving layer is essentially an API that scales for embedded analytics use cases.
They can all be viewed as synonyms. The requirements are the same, whether you call it a metrics layer, a metrics store, headless BI, or semantic layer. The phrases that have “metrics” in them aren’t preferable, because a metric can’t exist by itself. It also leaves out the concept of a dimension, along with hierarchies and attributes.
What are the key product components you need for a good metrics or semantic layer?
Keydunov pointed out that you have to define the connectivity layer: the inbound and outbound. The way we define it, it’s important to support multiple protocols like SQL, a Python interface for data scientists, and a REST or JDBC/ODBC interface for application developers. For outbound, you need a way to push queries to the platform layer. In the middle, you need a good modeling tool and language, an engine that can create that digital twin of your enterprise, a proactive caching layer, and built-in governance.
Keydunov added that in Cube Dev’s case they’re focusing on having a native SQL connector for every downstream application so consumers don’t have to build one.
What are one or two new use cases that customers can apply with this aggregated model of a metrics store?
At AtScale’s inception, the initial use case was OLAP on Hadoop — and that’s always stuck to the AtScale DNA. People want to do OLAP in the cloud. They like the dimensional interface, the speed, everything about OLAP except the technology that underlies it. There are a lot of SQL Service customers who want to go to Snowflake or DataBricks or Google BigQuery while maintaining that interface.
The second use case is the need for a single source of truth. Customers don’t want to relive the chaos they had in the past where they were creating their own source of truth even within their own workbooks.
The third use case is bridging BI and data science. BI teams need those features and predictions that data scientists uncover. The semantic layer is the glue that allows those teams to work together on one unified data set.
Keydunov added that a lot of people liked Looker/LookML, but some people want custom visualizations where they need a front-end designer — a use case where headless BI provides freedom on the presentation layer.
Nick noted another use case where business users can explore analytics themselves, which is not possible without semantic definitions.
Open source versus enterprise?
What’s important about open source? It’s a way of establishing standards and community. Everyone should be using the same language so they can share those semantic models — and so the community can contribute to those models. Everybody’s lives would be that much easier. Creating different engines for computing those models is where competition might come in, but it’s important to standardize and open-source the modeling language.
Cube Dev was open source from the first day, Keydunov mentions, but more should be open source: caching optimization, governance, integration. Handle adds that things like SQL optimization, data types, SCD tables, all thrive when they’re in the open.
What thoughts, strategy, or advice do you have for data teams that are either growing or sophisticated?
Even with smaller teams, Keydunov believes it makes sense to start implementing this. Even if it’s only one downstream tool, setting a foundation makes a lot of sense.
Handle states that large organizations want these kinds of semantic abstractions since they enable self-service and broader consumption. He sees small and medium-sized companies adopting this technology in the future.
As for me, I like the hub and spoke model where the hub represents the tools for controlling the data while business domains own the semantic models. I think domain experts should own the models for their domain, and you should be able to share and connect those models to create new views that can express the full range of the business.
You can watch the full discussion I had with these data leaders at the Metrics Store Summit 2022.
“When you have multiple presentation layers it becomes a real problem. We have diverse data consumers now, and they all require different data applications or presentation layers. Keeping the data model inside the downstream tools leads to a lot of duplication and inconsistency.” – Artyom “Art” Keydunov
“Historically the BI platform was monolithic, [but] people are figuring out they don’t want their semantic layer and BI tool wrapped up into one tool. Instead they want to solve the problem at a foundational level and pursue all the interesting things they can do with their data.” – Nick Handle
“You can’t force a user to change their habits. Getting them to use new tools is a tough ask. Don’t force them to behave according to your rules. Give them access to data and let them use it with the tools they know and love.” – David Mariani, AtScale
“Semantic layers have been around since the days of the first generation of BI, and even before that, the idea of how you define a metric in an organization has been around since a company was born. How do you define revenue, how do you define margins? There’s nothing new but it’s cool to see how the generations and all the external factors have evolved.” – Keenan Rice
SHARE
2026 State of the Semantic Layer