This blog is part of a series from Tobias Zwingmann, Managing Partner at RAPYD.AI. RAPYD.AI lets you easily and quickly build fully-functional AI prototypes or AI MVPs powered by state of the art AI-services from Google, Amazon and Microsoft. Tobias has over 15 years of professional experience working in the corporate world where his responsibilities included building data science use cases, digital B2B products, and developing an enterprise-wide data strategy. He is also the author of the O’Reilly book, AI-Powered Business Intelligence (2022). Follow Tobias on LinkedIn and Twitter.
The ability to understand complex datasets within a short period of time is one of the biggest challenges for business users and analysts alike. Recent advances in natural language processing (NLP) are rapidly opening up new and exciting ways to interact with data.
This article will give an overview of three surprising and promising recent developments in the field that should be on your radar to turn data into actionable insights.
Let’s start!
1. Q&A in Dashboards
The primary source of gaining insights from data has always been the ability to query and analyze data. With the advent of NLP, it’s now possible to create dashboards and applications that allow users to get answers to their questions in natural language.
We can differentiate between three levels of interacting with data through NLP:
Level 1: Keyword-Based Search
This is the most basic level of interaction. The user must explicitly enter the desired query and usually refer to the exact data fields or columns specified in the data schema.
For example, a user might ask:
Total sales in US in year 2019 vs. 2020
In the early days of NLP, this would require the data model to contain a table with the measure “sales” and a dimension where “US” is a possible attribute. There would also need to be a “year” column containing the values 2019 and 2020.
You can imagine how quickly these things break.
Level 2: Q&A-Based Search
At this stage of development, NLP is able to understand the context of questions and generate more meaningful results. Here, the user is no longer bound to the exact language used in the data model.
For example, if the user were to ask:
How much revenue came from the US in 2020 compared to 2019?
NLP would be able to map the question to the correct data fields and understand the context of the question.
By understanding context, NLP-based applications can provide more accurate and meaningful results. This is one of the biggest advantages of NLP-based data analysis.
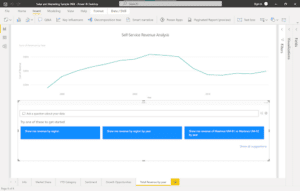
A practical application example of this technique is the Q&A tool in Power BI, which allows users to query their data and create custom visualizations using natural language. You can see this in the figure below:

Level 3: Conversational Analytics
The highest level of interaction of NLP-based data analysis is conversational data analysis. This approach mimics the way humans communicate and can make data analysis feel more like a conversation rather than a query.
For example, a user could ask:
How much revenue was contributed by sales in the US in 2020 compared to 2019?
And the answer could be:
In 2020, the US contributed $20M in sales, which is a 10% increase from 2019.
The user could then ask a follow-up question such as:
Which products led to this increase?
The application might then respond with a chart or visualization showing the top products that led to the increase in sales.
While that level of conversational analytics is still some way off, modern advances in NLP are slowly closing the gap.
Scaling NLP Queries Using a Semantic layer
A semantic layer is needed to fully leverage the potential of NLP across an organization with different users and data sources. This semantic layer can scale natural language queries and provide a common language to abstract a significant part of the underlying data complexity.
The semantic layer enables users across different parts of the organization to interact with and understand complex datasets using natural language queries while delivering strict governance and consistent insights.
2. Turning Text into Tables
Data analysis typically requires data to come in a structured, organized form usually expressed as tables. However, the vast majority of data in companies comes in so-called unstructured form according to multiple analyst estimates.
Unstructured data refers to any data that is not organized in any predefined manner. This includes emails, text documents, presentations, audio and video recordings, and social media posts. Relational databases and spreadsheets have a hard time making sense of that data.
Surprisingly, this is also an area where NLP, and especially large language models, can play to their strengths.
Consider the example of a typical earnings call from a publicly traded company like Snowflake.
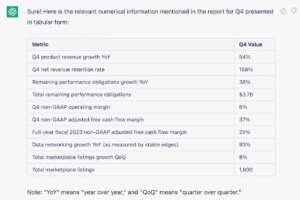
If we want to keep track of all the data and information mentioned in this earnings call (via transcript), we have two options. We could either go through it by hand and pick the relevant pieces of information or we could ask a large language model, such as ChatGPT, to do the heavy lifting for us. For example, we could feed the above mentioned earnings call transcript into ChatGPT, and run the following prompt:
Extract the relevant, numerical information mentioned in this report for Q4. Output in tabular form.
As a result, we will get this table here:

It’s impressive how quickly and accurately large language models can extract information like this from an unstructured document. However, we have to be aware that this technology is still very young, and we might want to double-check the results.
With more advancements of the technology and the general availability of these services through APIs, we can process unstructured data at scale — and make it readily available for downstream analytical tasks.
3. Adding Narration to Visuals
Lastly, NLP can not only help us to get faster insights from data, but it can also take some of the tedious work away from us.
Crafting data stories and explaining visualizations is crucial for data analysts who want to effectively communicate insights to stakeholders. The process of adding conclusive annotations, however, can be quite tedious and is too often skipped.
With the help of AI technology, data analysts are now able to create captions or annotations for a given visualization and its underlying data automatically.
These annotations could highlight key takeaways, point out trends, and be easily edited to suit different audiences. They also make reports more accessible to those who are visually impaired.
Even if that sounds very advanced, this technology is no longer experimental and is ready to use, even for commercial purposes.
For example, Power BI has an AI-powered built-in feature called Smart Narrative, and Tableau has a similar equivalent called Data Stories.
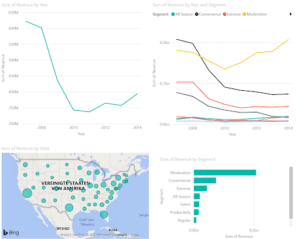
Let’s take a closer look at the Power BI example. Consider the following report:

We can recognize immediately that there are plenty of things going on here.
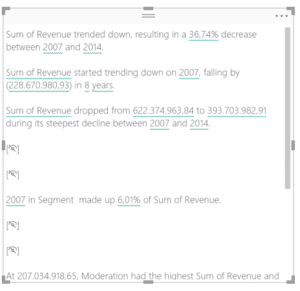
Without going too much into detail, let’s see what happens if we drag the smart narrative toolbox to the canvas and generate automated annotations for the whole report page:

When you look at the output, there are a couple of interesting things note:
- Power BI picked up on a decrease in overall revenue and automatically calculated the percentage change between the beginning and end of the revenue time series, which helps with the overall interpretation.
- Every text in this output can be formatted to enhance readability and aesthetics. For example, we can change the way numbers are displayed or rounded off. We can also define synonyms for aggregated measures like “Sum of Revenue” to be “Total Revenue” for example.
- All the automated captions here are dynamic and adjust according to changes in underlying graphs. For example, when you apply a filter to only show data from after 2010, the overall text would get updated and reflect the insights based on the new data.
As you can see, auto-generated captions are a great way to make reports more accessible to business users and also help to convey the most critical insights from a report — without much manual labor involved.
NLP — A New Doorway to Data Insights
NLP is becoming an essential tool for data professionals. As we have seen above, NLP technologies can help us to get insights faster, process large amounts of unstructured data, and also write automated summaries on data annotations.
While there’s still a long way to go, recent advancements in NLP have already made a significant impact on the field of data analytics. A good part of them are already available in popular BI tools, ready for you to try them out!
The power of AI tools, like NLP, is basically essential in modern data analytics. View our on-demand webinar on bridging AI and BI for better business outcomes to hear more critical insights.


SHARE
Guide: How to Choose a Semantic Layer