
No matter how sophisticated and agile an enterprise BI program may be, there is always a need to go deeper than canned reports and dashboards. Business analysts’ primary role is to figure out what the data is saying and support decision makers in understanding what’s underneath the top level results. Ad hoc analysis is the freestyle event in data and analytics olympics. It’s both art and science. In practice it means zooming from high level into the detail and then back out again to really understand what is driving top level results. It may result in a discrete answer (e.g. why did overall sales shift in a particular direction). It might be more generic (what are the key drivers of demand in a particular region).
There are many reasons why ad hoc analysis is used across organizations. Ad hoc analysis is typically focused on finding quick answers to data questions. It essentially means creating a an analysis on demand, allowing the decision-maker to quickly act on the ad hoc insights without waiting for a formal dashboard to be created or recreated.
For generations of business analysts, Microsoft Excel is the ultimate ad hoc analysis tool. As we have been discussing in this blog series, combining AtScale with Excel delivers a highly flexible, but powerful BI platform that is perfect for ad hoc analysis.
Resolving Common Challenges of Ad Hoc Analysis with AtScale
Although ad hoc analysis is extremely common in business, there are two basic challenges that consistently arise:
1. Incomplete Data: The complexity of getting at complete data sets that are siloed across different clouds and applications can make it difficult to get the full picture in an time-critical ad hoc analysis exercise.
2. Lack of Governance: Business analysts that are under the gun to get an answer, may make assumptions about the context and meaning of certain data sets. This sets up potential inconsistencies with formal reporting and can jeopardize credibility of an ad hoc analysis.
AtScale’s universal semantic layer allows for the business to resolve these challenges that come about in ad hoc analysis. By creating a single semantic model the BI users are able to pull data from a single source of truth and pass governance rules for the proper handling of the business data.
Atomic Detail DrillThrough via Excel, through the AtScale Semantic Model
To create a drill through in the AtScale cube canvas, the user should navigate to the “Drillthrough” tab from the ribbon on the right. From here the user is able to add a drill through to their semantic model. A drill-through will allow for the BI user to drill up or down in their analysis, enabling a higher or lower level of abstraction in the analysis.
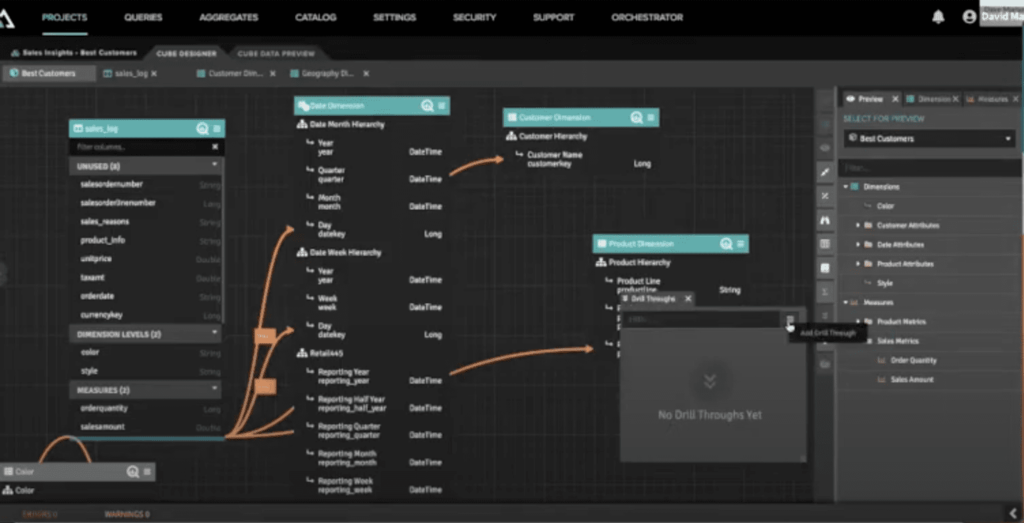
Once the user has navigated to the “Create Drillthrough” window they are able to define the attributes in the drill through.
Once the model has been published the BI users are able to access the newly created drill through in their analysis tool of choice.
AtScale + Excel delivers a few powerful advantages for business analysts charged with executing ad hoc analysis. They can ensure that they are working from the same governed data sets that power formal BI reports and dashboards – removing risk of inconsistencies. And they can leverage dimensional analysis techniques to drill into results along governed dimensions – all the way to atomic level data. This ensures that stories they develop, or conclusions drawn on ad hoc analysis, are grounded in truth and consistent with other reports.
SHARE
Guide: How to Choose a Semantic Layer