
I’ve asked it before and I’ll ask it again. Wouldn’t it be great if you could easily analyze ALL your data from a Excel single file? We all know this isn’t feasible; especially when dealing with big data and complex business analytics needs.
In working at the intersection of Big Data and traditional Business Intelligence, the AtScale team has encountered a number of complex business analytics use cases that are difficult, if not near-impossible, to solve using typical table-based data models and SQL. Today, I’m going to share why and how complex analysis, like for multi-level metrics, is no longer as ‘difficult’ nor ‘near-impossible’ as it once was.
HOW SIMPLE ‘PLAN VS ACTUAL’ IS ACTUALLY QUITE COMPLEX
For enterprises in the retail space it is important to be able to analyze Actual business performance compared to Plan, both of which are updated on a frequent basis. This “plan vs. actual” analysis is critical in identifying which elements of the business are outperforming or under-performing relative to the established plan.
Take for example a large automotive parts distributor, who may stock 10s of millions of items, and process 100s of millions of sales in a given year. That’s a massive amount of data, increasing in volume and velocity, that needs both a place to land, and to be quickly accessed for analysis. More and more of these large data sets are being stored in big data platforms like Hadoop. And while Hadoop provides a low-cost and performant approach to store and process this information, there is an additional challenge of supporting the types of business analytics that are required on these data sets.
When comparing plan vs. actual performance for this automotive parts distributor, some typical questions that a business analyst might ask and need immediate answer to include:
- Question 1: Which stores contributed the most and the least to the overall plan for the region
- Question 2: Which regions over-achieved their plan? Which regions under-achieved?
- Question 3 & 4: How does overall plan attainment fluctuate with time? Are some product lines consistently outpacing their planned sales?
THE CHALLENGE WITH TABLE-BASED MODELS
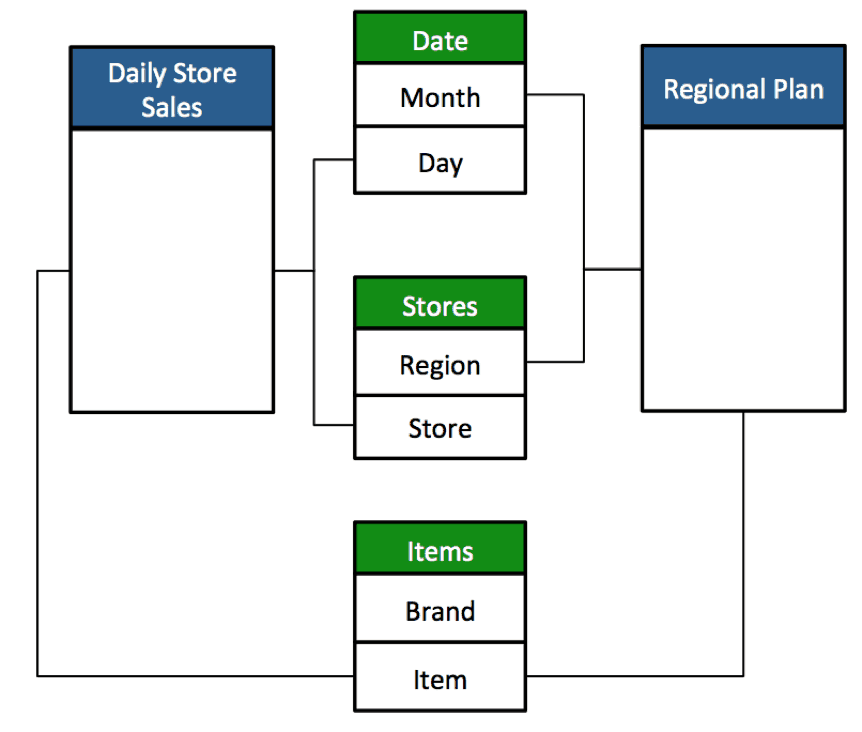
Conceptually, a model that supports the use case described above, is shown in Figure 1 below.
Figure 1 is a multi-fact model, meaning the measures of interest come from two separate fact tables. The tables are at different levels of granularity.
- The Regional Plan fact table is at the grain of month, region, and item
- While the Daily Store Sales fact is at the grain of day, store, and item.
Figure 1: A Multi-fact model
A challenge arises when measures from multiple fact tables (in this case, Store Sales and Regional Plan) need to be evaluated at different levels of the same hierarchy. For example, how should a query respond that tries to group “Regional Plan Sales” by “Store”?
- The Problem: The need to evaluate measures (date, stores, items) from multiple fact tables (Daily Store Sales, Regional Plan) across dimensions (month, day, region, store, brand, item) that aren’t shared by both fact tables
- The Typical Query Response: Since Regional Plan Sales have only exist at the Region (not store) level, a naive query would simply return no rows of data.
- The Required Query Response for Accuracy: However, what should be returned is the ‘regional level Planned Sales metric’ for ‘each store’ that belongs to ‘each specific parent region’ in the ‘Stores hierarchy’. With this query capability it is now possible to calculate a “Store Sales Contribution to Regional Plan” metric in the form (Store Sales) / (Regional Plan Sales).
THE ACCURATE APPROACH
To solve this challenge, an additional business semantic layer is required that abstracts away the underlying table structure and additionally asserts the appropriate business logic and data handling instruction sets that enable the business analysis described in the scenarios earlier. In AtScale this is achieved through a combination of our multi-fact model support along with the ability to specify how to handle the “multi-fact with multi-level hierarchy” use case described above.
To support the calculation of metrics like “Store Sales Contribution to Regional Plan”, AtScale provides ability to evaluate a measure across any level of a related hierarchy. When using this feature, analysts or modelers can specify whether to show empty values or repeating values for the rows of the result set that are at a lower grain (i.e.more granular) than the level available in the source fact table. For the Store Contribution metric our “repeating values” option allows a Regional Plan metric to be compared to a specific store’s Actual Sales metric. This enables the ability to generate detailed and accurate results like Figure 2 shown below.
Figure 2: Store Sales Contribution to Regional
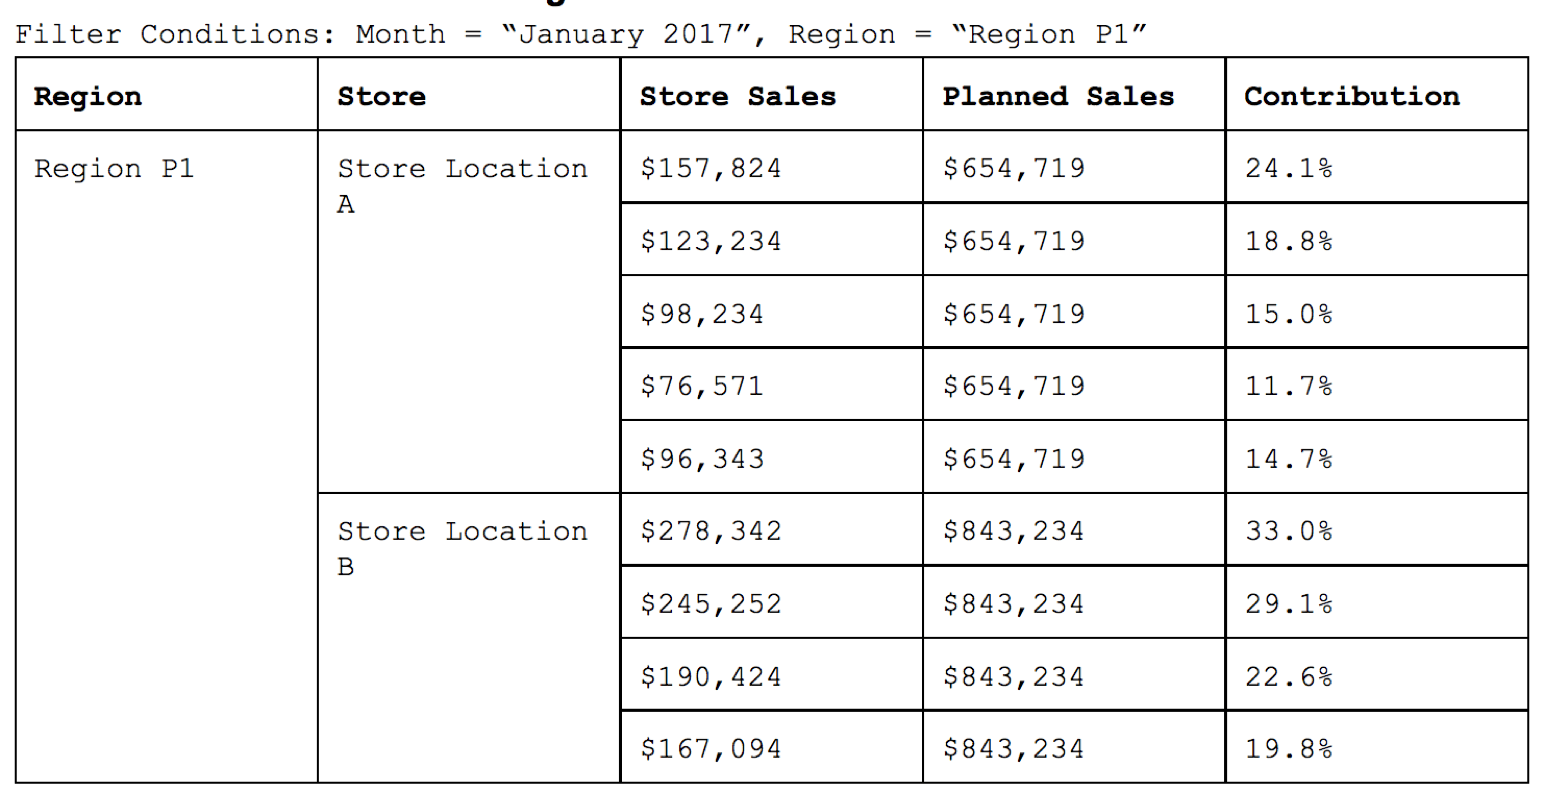
The end result… an accurate result of Store Sales + Plan Sales calculated across all locations and regions, even though fact tables aren’t shared across the stores dimension!
MULTI-FACT MULTI-LEVEL HIERARCHY METRICS IN ACTION
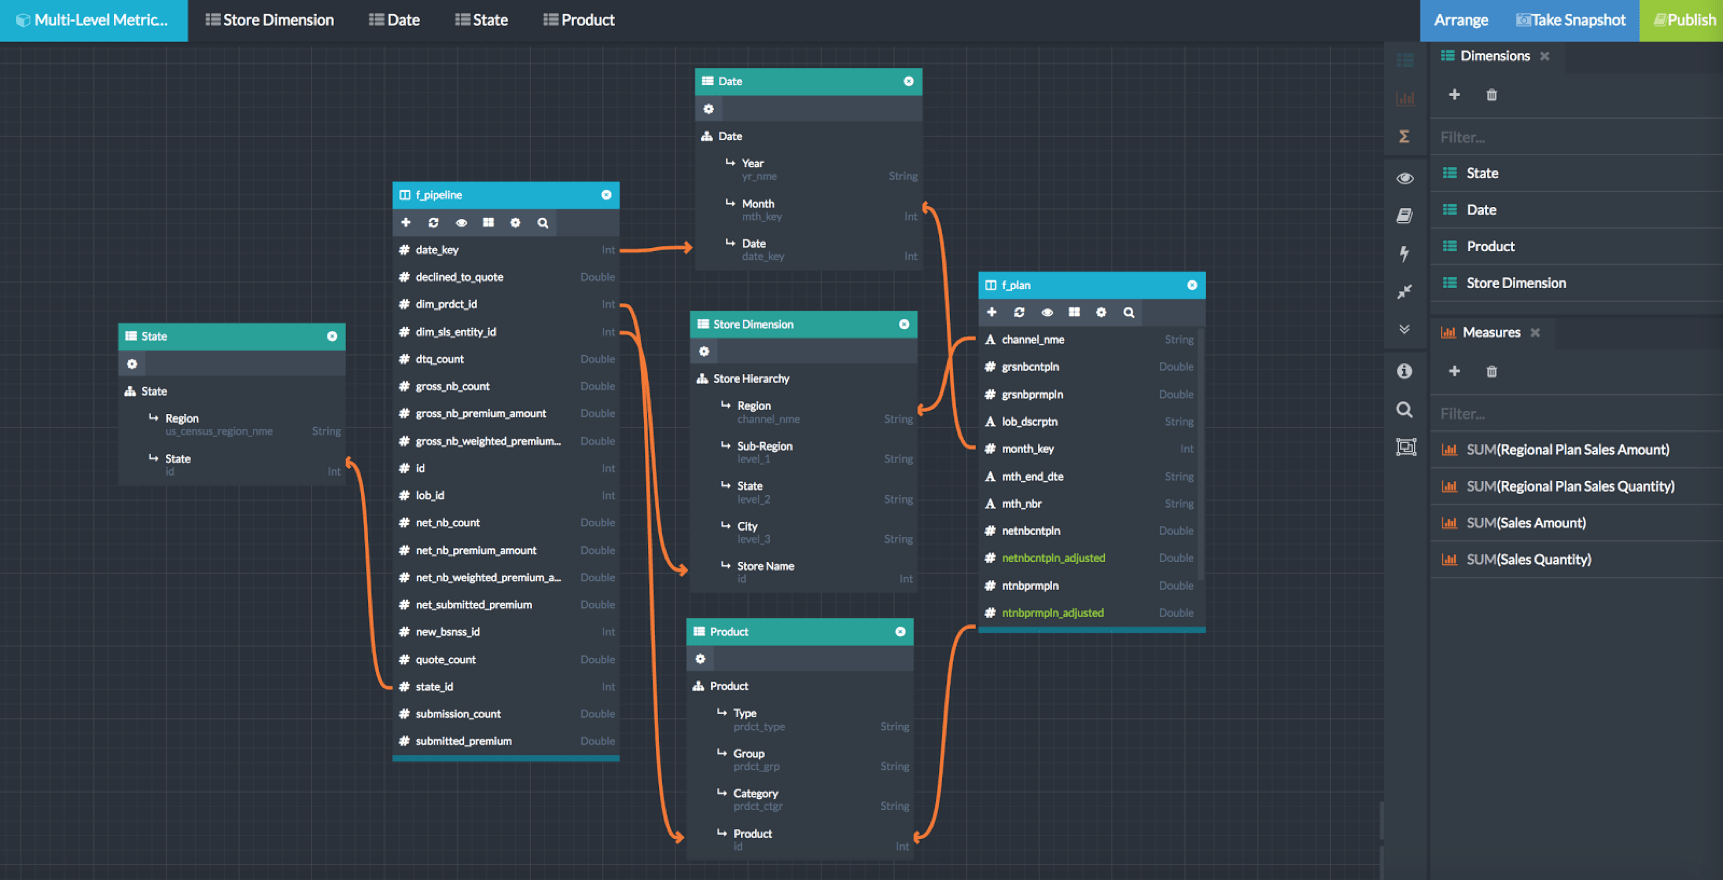
With this background on the complexity and desired results of evaluating the “Store Sales Contribution to Regional Plan” metric, let’s take a look at how this happens in the AtScale Intelligence Platform. In this example, we’ve created a simple multi-fact model as shown here. The model in Figure 3 below has…
- A Sales fact table
- And Plan fact table
- Both of which have a shared relationship with Date, Product, and Store dimensions.
- Additionally note that the Sales fact table has a relationship with the “Store Name” level of the Stores hierarchy while the Plan fact table has a relationship with the Region level of the Stores hierarchy.
Figure 3: Model with several base measures, including 1) Sales Amt 2) Regional Sales Plan
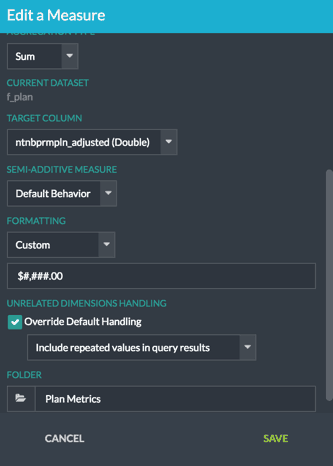
To ensure the desired behavior when evaluating the Regional Sales Plan Amount metric relative to lower levels of the Stores hierarchy, the “Unrelated Dimensions Handling” setting on this metric (See Figure 4) has been set to show repeating values for queries involving group-bys on lower levels of the hierarchy
Figure 4: Unrelated Dimension Handling
Once the base metrics have been designed a calculated measure – the Store Sales Contribution metric – can be defined as in AtScale using MDX as:
(Measures).(m_store_sales_amt_sum)/(Measures).(m_reagional_plan_sum).
Upon publication, the AtScale Virtual Cube can be queried using BI front end tools whether they use the SQL or MDX query language. This means that different BI tools like Excel (that uses MDX), Tableau (that uses either), and MicroStrategy (that uses SQL) can all be used to query the same virtual cube.
Let’s take a look at how the Store Sales Contribution metric can be analyzed using Tableau.
As shown in the video, the user of a BI tool like Tableau is shown a simple interface – measures and dimensions – that abstracts away the need to understand the relationships between the various underlying tables. Additionally, the end user is able to easily evaluate all of the available measures across all of the dimensions in the virtual cube. When the Store Hierarchy is expanded below the Region level, the AtScale virtual cube returns repeating values for the Regional Sales Plan metric.
In any larger organization, there are a number of BI clients (aka analytics tools) that need to be supported; including the world’s #1 analysis tool, Excel. As asked at the start of this blog – wouldn’t it be great to also be able to use Excel to analyze this same data set described above? With AtScale’s unified semantic layer, this IS possible. Since AtScale acts as an XMLA data provider, Excel users can connect live to the same virtual cube as if it were a SQL Server Analysis Services data provider. And even though Excel has been known to not respond in the timeliest manner on large datasets, let alone a data set stored in Hadoop, Excel users can query the same virtual cube that Tableau did and get teh same result. Here’s a quick of what the Excel experience would look like
Before wrap-up, I need to ask. Do you realize what you just saw? If your jaw didn’t just drop, I ask you to grab a data analyst, or a Tableau user, and show them. I assure you, after spending close to 20 years in BI and Big Data, and flogging myself and tools trying to do this very thing, even I’m amazed when I see it in action. This stuff isn’t easy. It normally requires what, as I’ve been quoted saying before, many enterprises call “query script and coding gymnastics’. But now, it’s possible, without manual coding, and without the gymnastics.
AtScale is the only business interface provider that supports native MDX and SQL queries against the same underlying cube definition using both a big data platform and BI tool of your choosing. The end result is that all your analysts and BI users get the same answers, at the speed of thought, and without moving data.
IN CONCLUSION:
When it comes to doing business analysis, it is imperative to remember a few key points that will help you and your business users connect the dots when dealing with the sometimes messy world of data and unrelated dimensions that in the real world ARE related.
- Empower your Users: Provide an interface that business analysis can use to model and express data in a form that matches the concepts in their mind.
- Simplify the Complex: Abstract away the complexity of underlying tabular relationships.
- Accuracy in Complexity Counts: simple sums, roll-ups, and counts are not sufficient to support the multi-level and multi-fact questions that business analysts need to answer.
With AtScale, enterprises are able to satisfy the requirements of complex business analysis, even on the on the largest of data sets.
Shoot me a comment, idea or even a question on other ‘messy and complex big data analytics’ challenges you’ve seen lately. I love a challenge, and I love solving them even more.
~ Josh
SHARE
Case Study: Vodafone Portugal Modernizes Data Analytics