We’ve been publishing a lot of new case studies based on our experience helping customers get value from AtScale’s semantic layer.
With that in mind, we’d like to delve into our partnership with Tableau. The well-known data visualization tool is used by many of our customers to manage dashboards and interactive analytics for cloud data modeled within AtScale. AtScale has a long history of working successfully with Tableau. Given this, I thought it would be helpful to do a blog series on AtScale + Tableau and discuss the value customers get from this partnership, along with real-world examples of customer success.
The first in this series is based on a conversation and panel discussion I moderated with Larry Clark, a distinguished solution engineer at Tableau. Our discussion focused on how combining Tableau and an AtScale semantic layer makes data more accessible across organizations and enables self-service BI.
Here’s a summary of the key takeaways from our discussion and some insightful customer stories that relate to our conversations with Larry.
Analytical Empowerment and Productivity
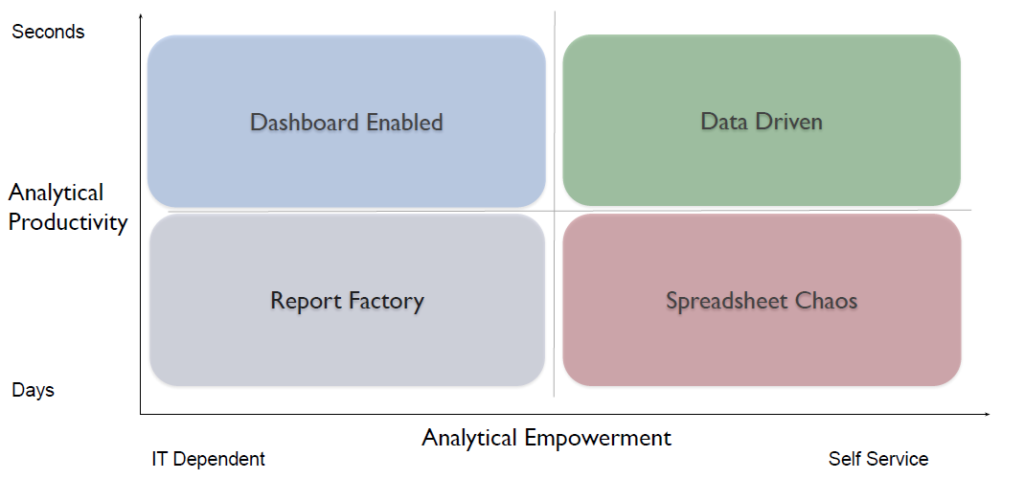
Our talk with Larry Clark focused on helping companies become more data-driven to make better, more informed business decisions. He shared a fascinating model that charts a company’s data analytics maturity by examining the convergence of analytical empowerment and productivity.
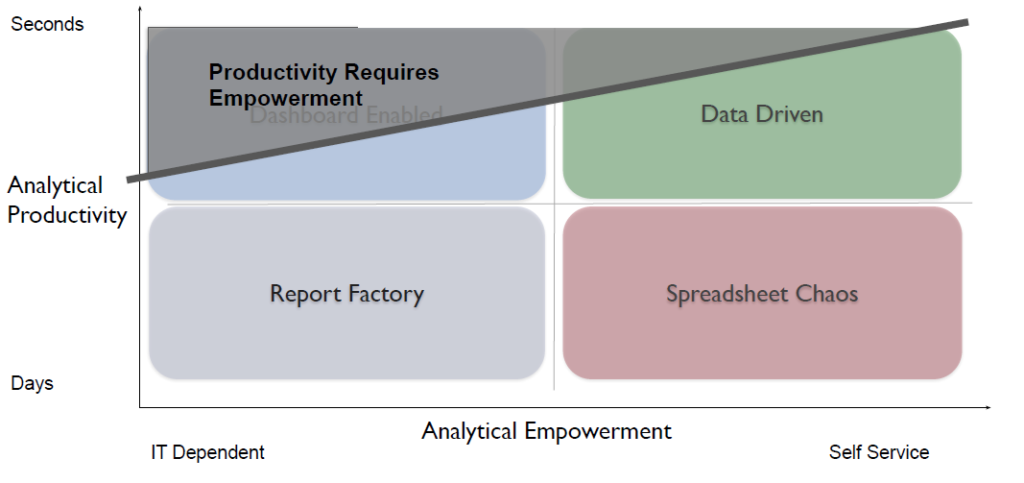
The model seeks to understand how quickly a knowledge worker can find the insights they are looking for or even the surprising insights they didn’t know they needed. Applying real-world decision points to the model tells us that the productivity ceiling for a knowledge worker is lower the more dependent they are on IT to answer their questions. In other words, productivity requires analytical empowerment. That means knowledge workers need to take the initiative and have the ability to gain valuable, dynamic insights from all available data. So how do we get there?

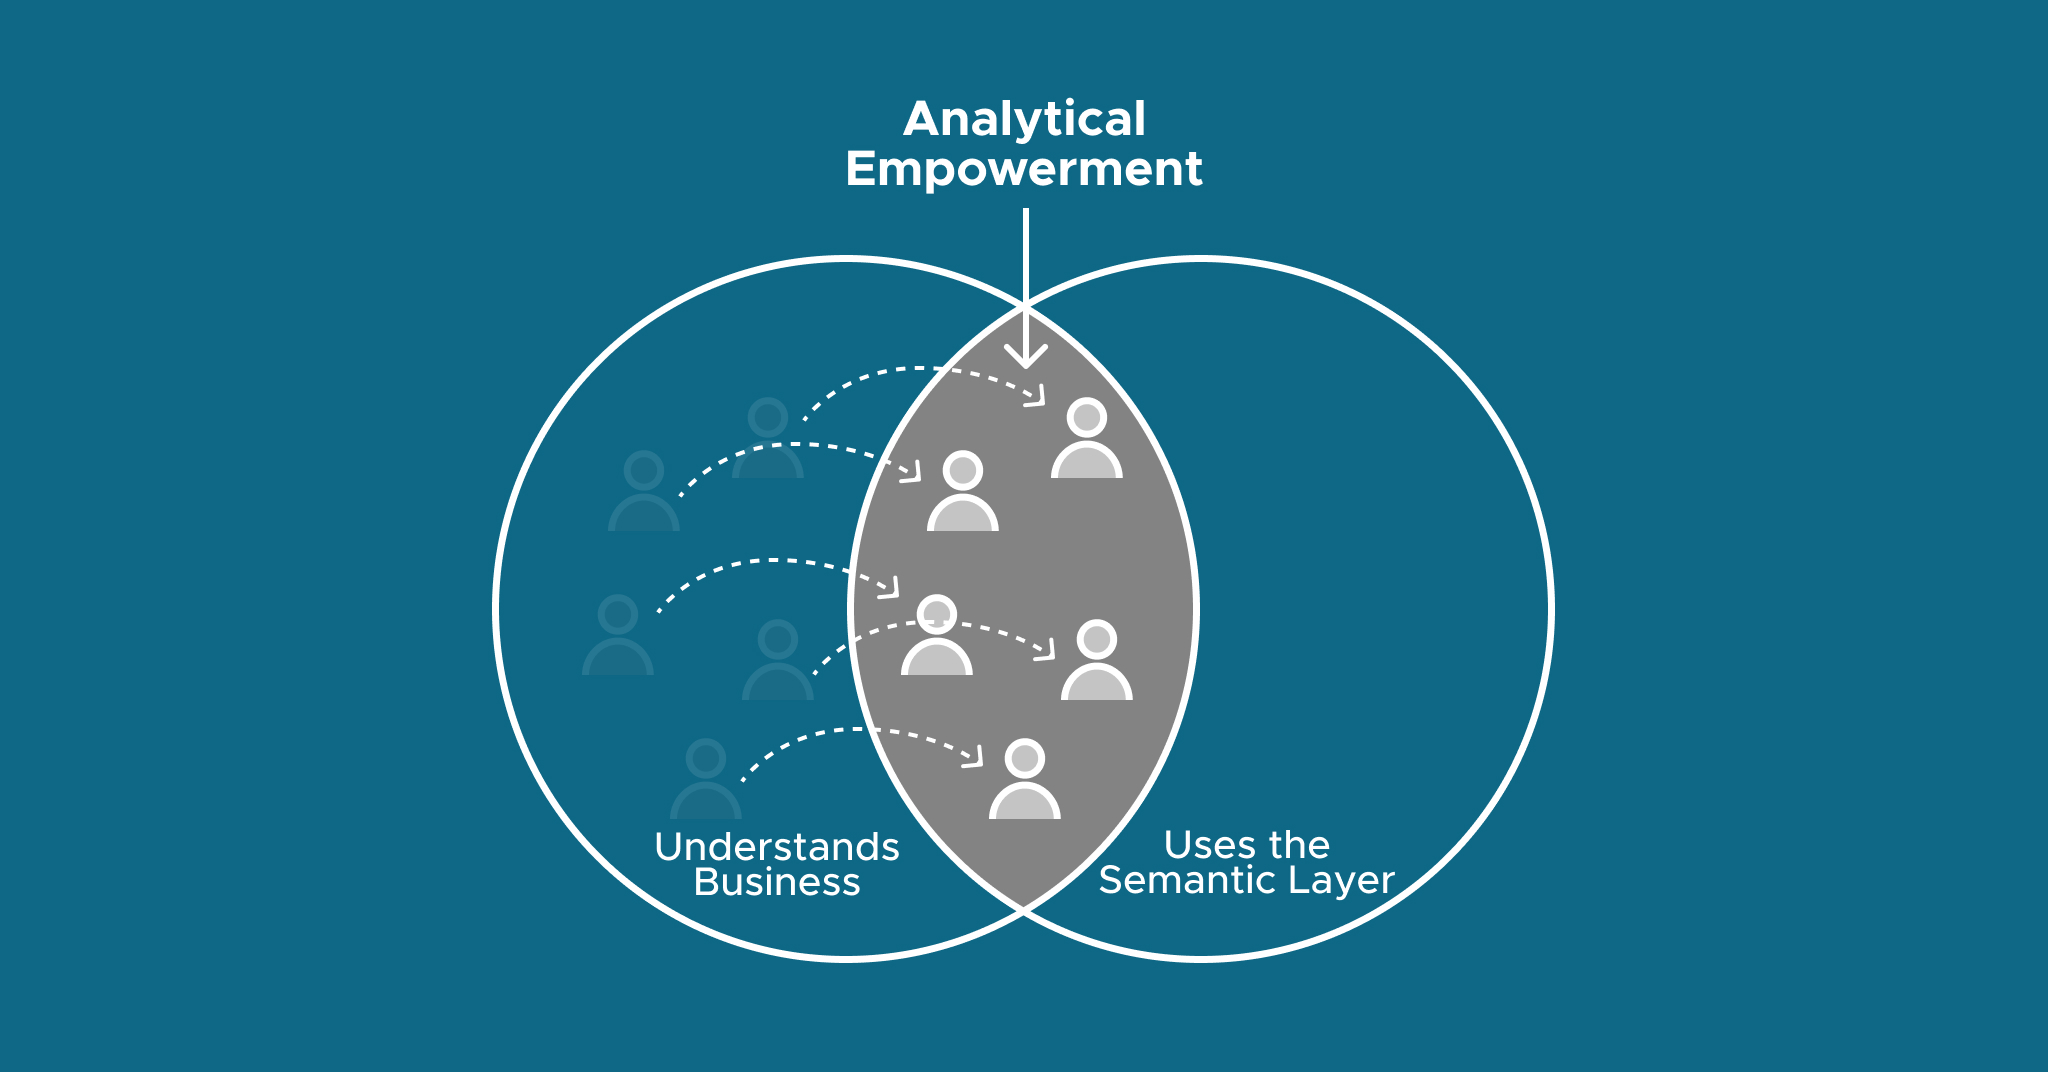
Analytical empowerment enables the people who understand the business to ask data-driven questions. That requires tools and processes that support self-service and also technology solutions that make it easy to draw insights from one version of the truth, no matter how many underlying data sources there might be.
The best way to deliver that combination of useability and access is to enable visual analytics. Curating semantic models is the best way to accomplish this because suddenly, raw data can be modeled, visualized, and made readily available to the people who understand the business.

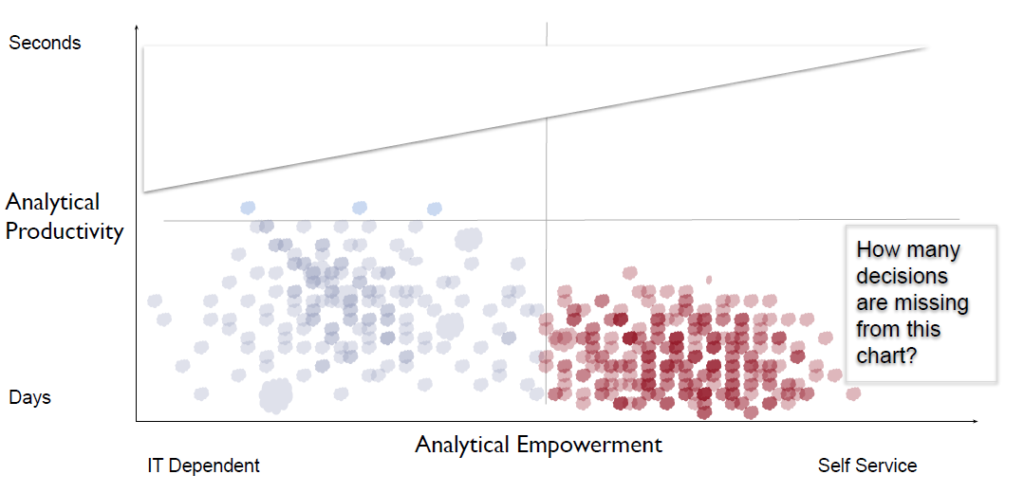
Larry also walked us through a fun mental exercise that would benefit any company trying to understand where they are on the path to becoming data-driven. Think about your company’s productivity regarding how long it takes to make decisions, from days to seconds. Also, think about how empowered those decision-makers were. Did they have to submit a request to a technology group to get the information they needed? Was it self-service? Or somewhere in between?
Chart every data-oriented decision your company made in a given period according to these metrics. Now, think about how many decisions were not made because there was too much friction in getting the information. It’s a vital thought process because it can help us identify where and how we can become more data-driven.

Before we wrapped up, Larry shared some insights into why the semantic layer is so critical to achieving self-service, faster decision making, and analytical empowerment. One barrier for getting to a self-service model is the inclination for IT and data process owners to default to control over empowerment. Their concerns stem from having multiple data sources and entry points, leading to decision-makers potentially working from numerous versions of the truth.
The semantic layer provides a solution to this problem by providing a single source of truth. It allows knowledge workers to directly model their information to be relevant and actionable to the issues they are attempting to solve.
If you want to hear directly from Larry or any of our other expert panelists, check out our webinar on How to Deliver Actionable Insights At Scale.
Case Study: Eliminating shadow IT at Cardinal Health with Atscale + Tableau
Cardinal Health — a multinational healthcare services company — strives to advance healthcare and improve lives daily. A series of acquisitions led the company into managing its data with a fragmented set of systems, and managing it all became very complicated in a hurry.
Cardinal Health’s challenge was to leverage modern self-service analytics across their fragmented systems and data sources. Many of their systems analysts turned to shadow IT to streamline tracking metrics, which exacerbated the problems.
To solve these issues, the company leveraged Google BigQuery and AtScale’s Semantic Layer to work with their preferred BI tools, primarily Tableau. That enabled business users to perform self-service analytics without learning an entirely new BI tool. Their Tableau knowledge and workflows still applied but were now empowered by self-service analytics.
With AtScale, Cardinal Health created a universal source of truth for their organization. Despite fragmented underlying data sources, their metrics are clearly defined across different teams and contextualized for their needs with simple modeling capability. Cardinal Health continues to roll out its new data and analytics platform across the company and expects to have over 1,000 users leveraging self-service analytics soon.
Accelerating Self-Service BI with AtScale’s Semantic Layer
Extracting actionable insights from information requires the right mix of people, processes, tools, and data. Everyone should be working from the same terminology and a single source of truth.
The goal is always to empower business leaders and knowledge workers to make better decisions. Achieving better decision-making across an organization means driving context into data and making it available to those who need it. AtScale’s semantic layer helps companies deliver contextualized insights and work with leading BI tools like Tableau, so knowledge workers don’t have to relearn their jobs to make better decisions.
This post is part one of a three-part series exploring how the Semantic Layer works with BI tools like Tableau to deliver Self-Service BI at scale.
Watch our panel discussion with Larry here and read more about how Cardinal Health leverages AtScale’s Semantic Layer here.


SHARE
Case Study: Vodafone Portugal Modernizes Data Analytics