The ability to access data from Snowflake in a consistent manner is crucial for scaling analytics programs and building a self-service BI culture. In addition to providing control and analytics governance, the AtScale universal semantic layer accelerates BI query performance and helps control runaway compute costs. AtScale forms a single source of truth for important business metrics and analysis dimensions.
In this tutorial, we’re going to use AtScale to build a semantic layer for Snowflake and consume data via several popular BI tools. We’ll also explain how AtScale can help you to scale self-service BI on Snowflake. Let’s get started.
Building a semantic layer from raw Snowflake data
From AtScale’s Design Center, we can define our semantic layer based on our raw Snowflake data. This will allow us to create a unified abstraction of our raw data to make it more accessible from a variety of BI tools.
Create a new model
We can start by creating a new model by clicking “New Cube,” which we can call “Sales.” This semantic model will allow us to create a multidimensional representation of our raw Snowflake data.
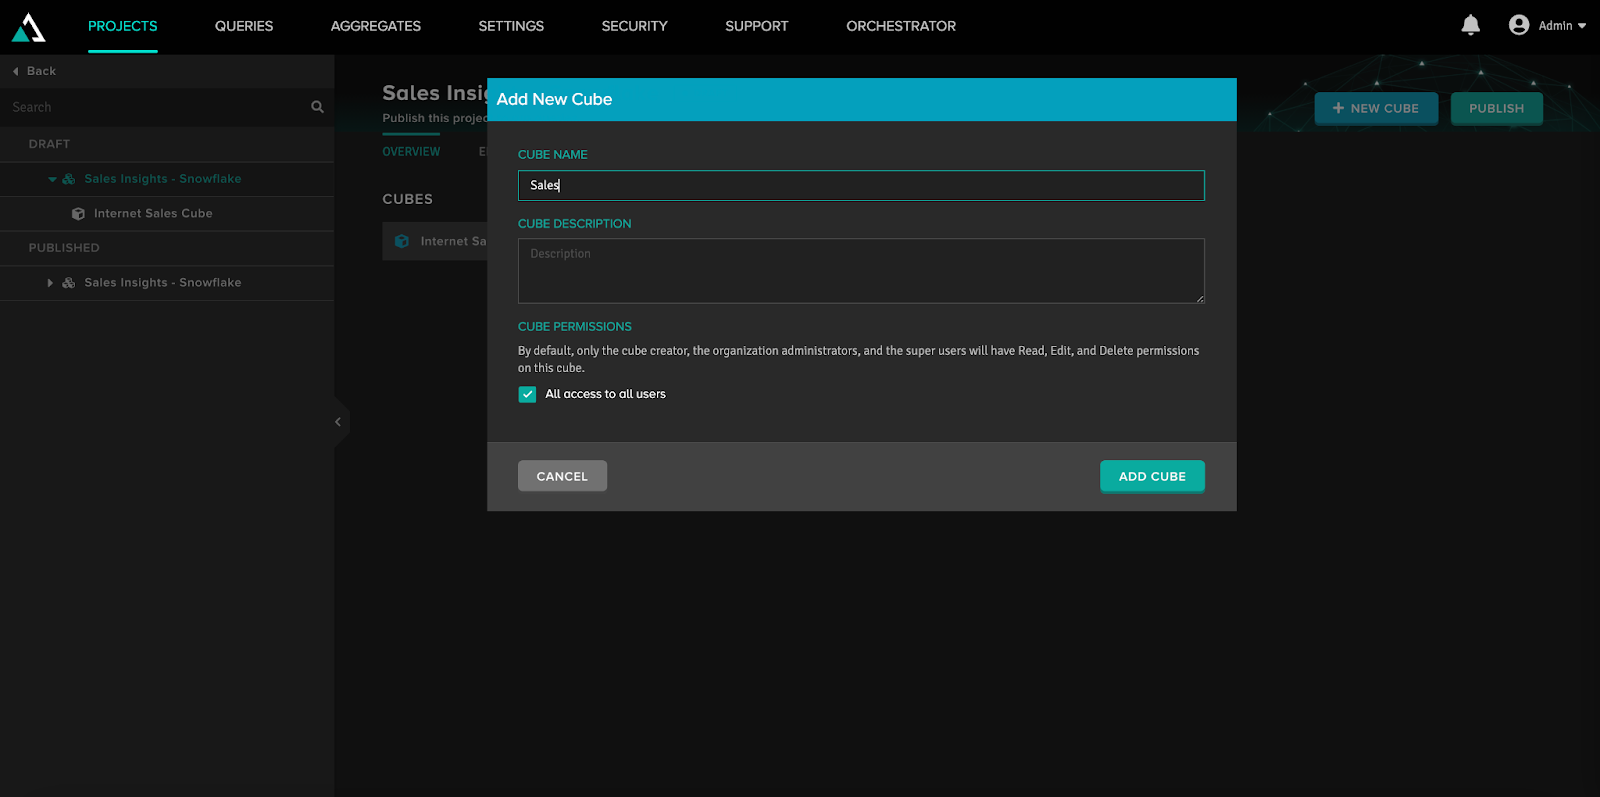
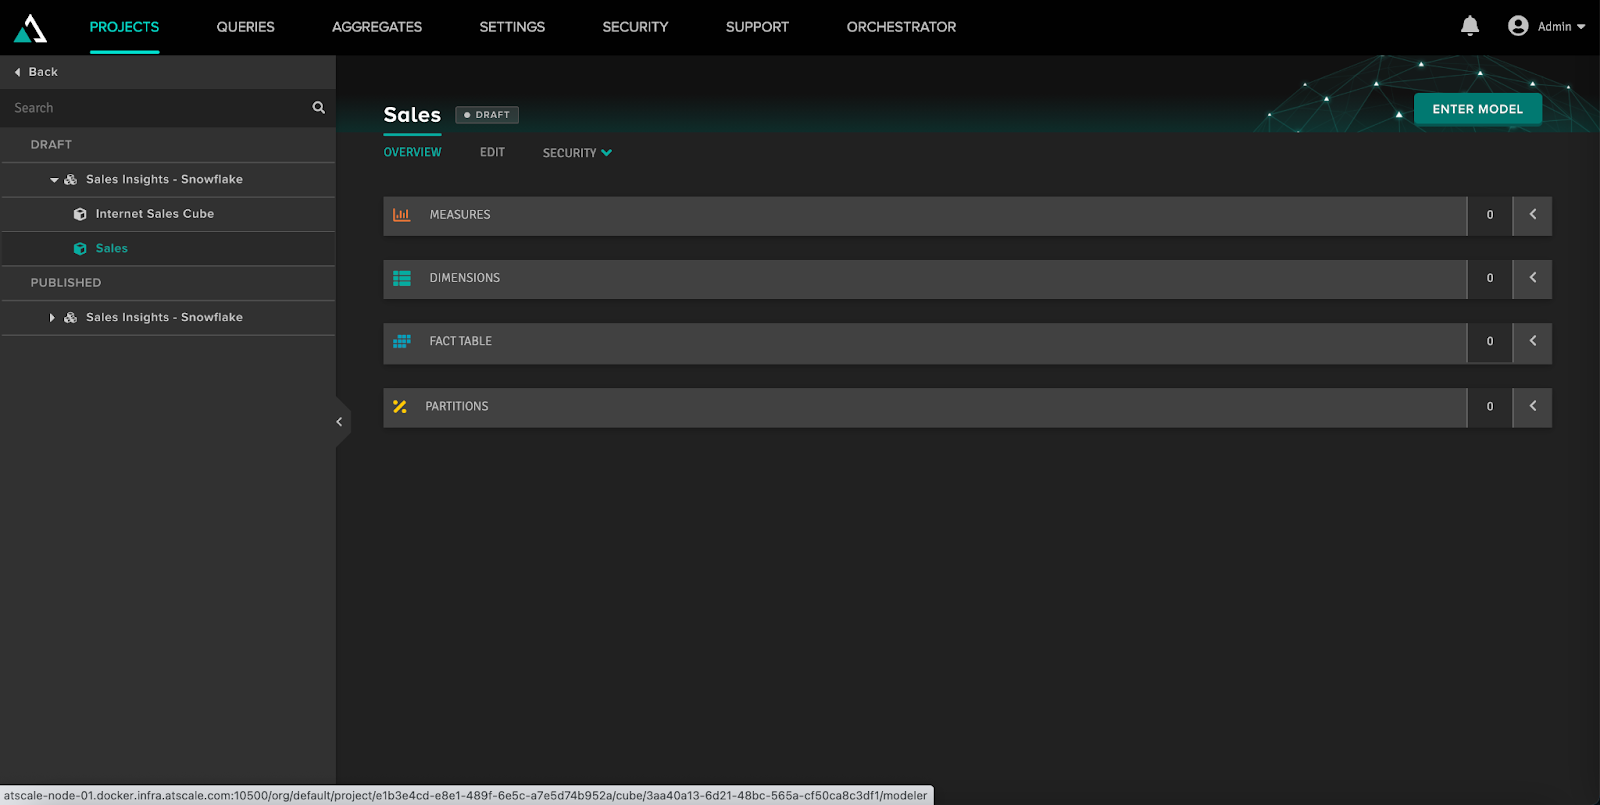
Once the new cube is created, we can access it and then click “Enter Model” to go to the AtScale’s Design Center canvas.
From the canvas, we can integrate our raw Snowflake data into our new semantic model, which can then be consumed by anyone in the organization. Before we start modeling, we need to pull in our data sources so that we can browse through the data stored on Snowflake. In this case, we’re going to drag in “sales_logs” data we have in our sample database.
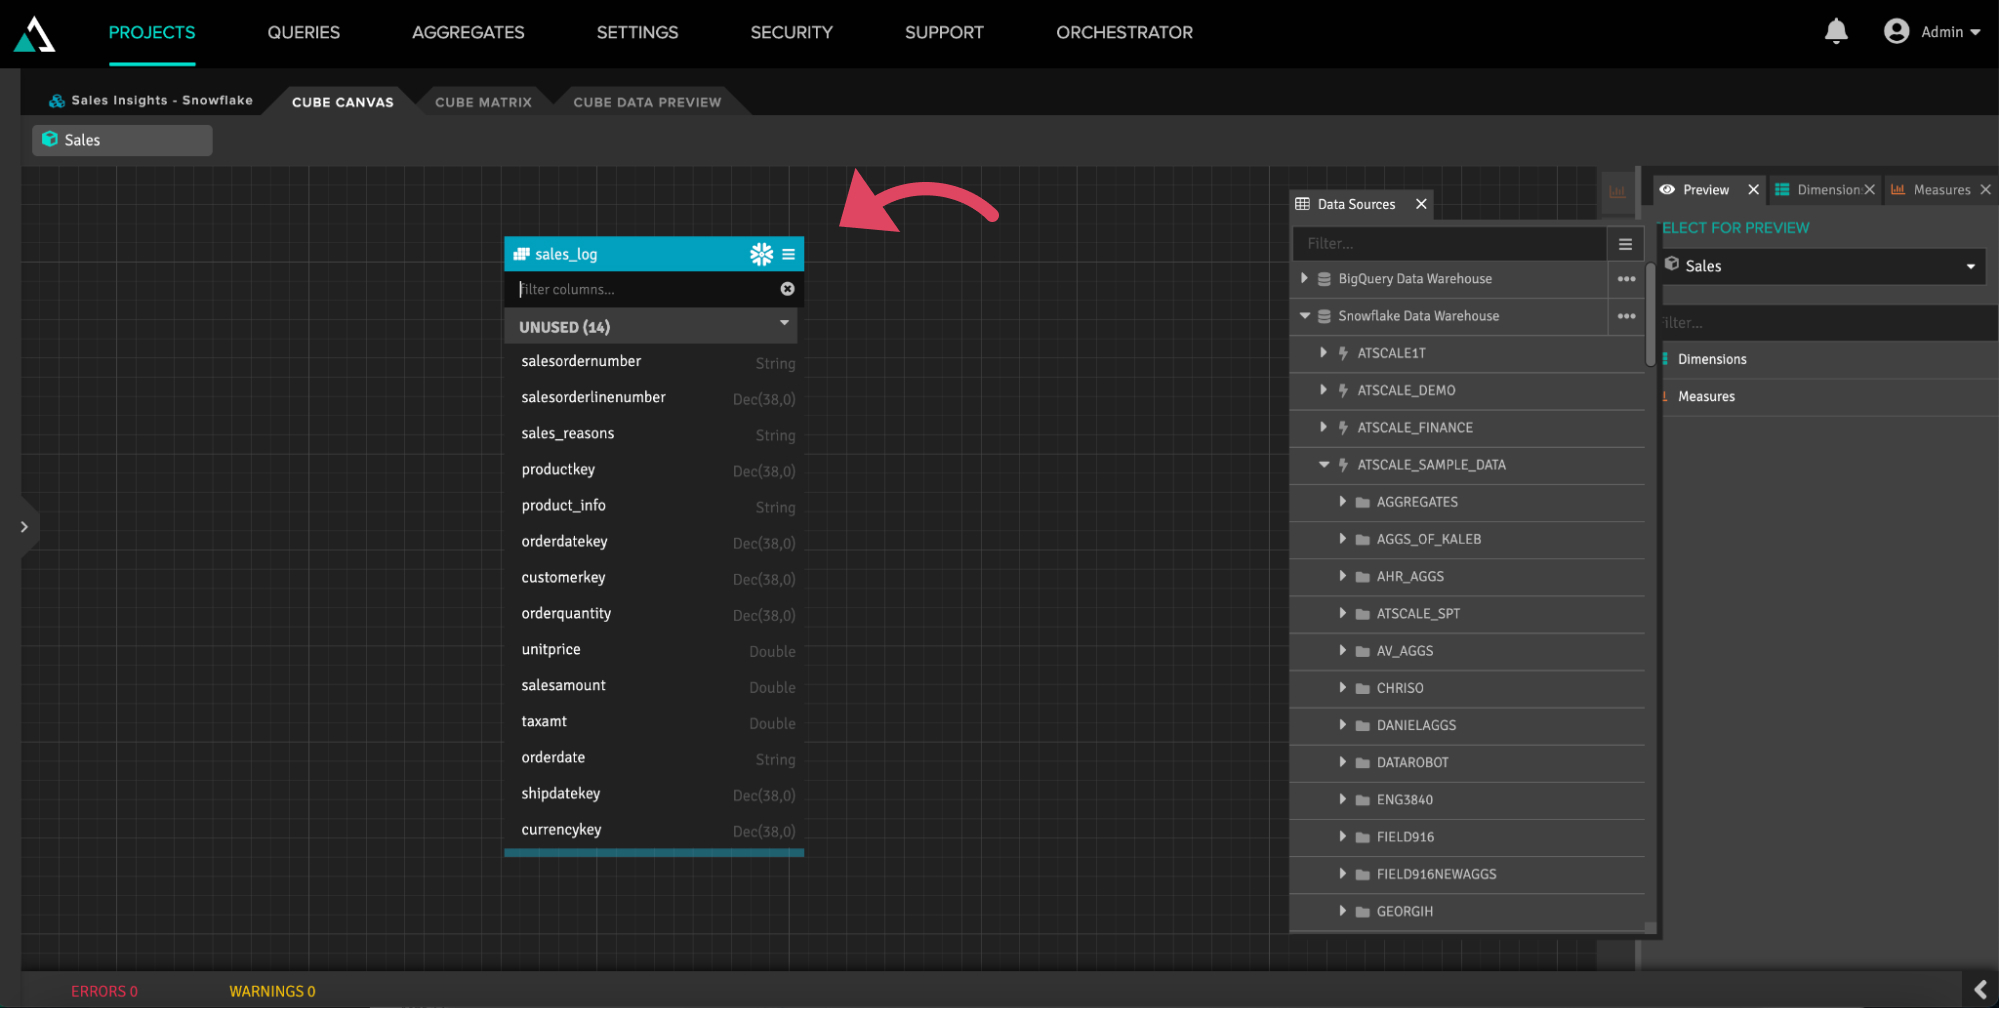
Once the data source is included in the canvas, you’ll be able to see all of its raw data fields without any data modeling effort.
If you want to correct bad data or do any other data wrangling tasks, you can double-click on the data source to see the information in its original table format.
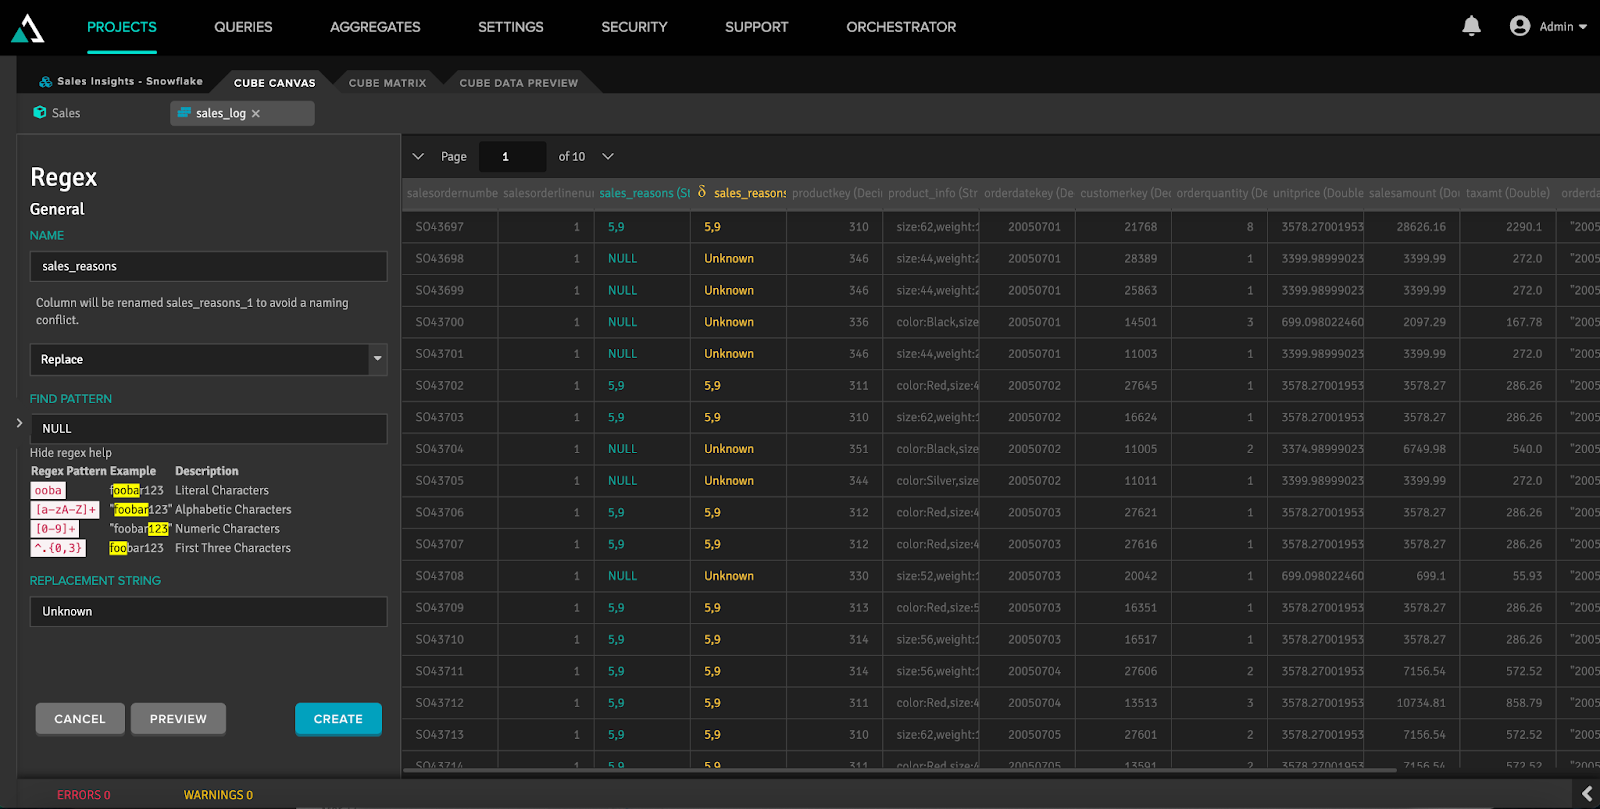
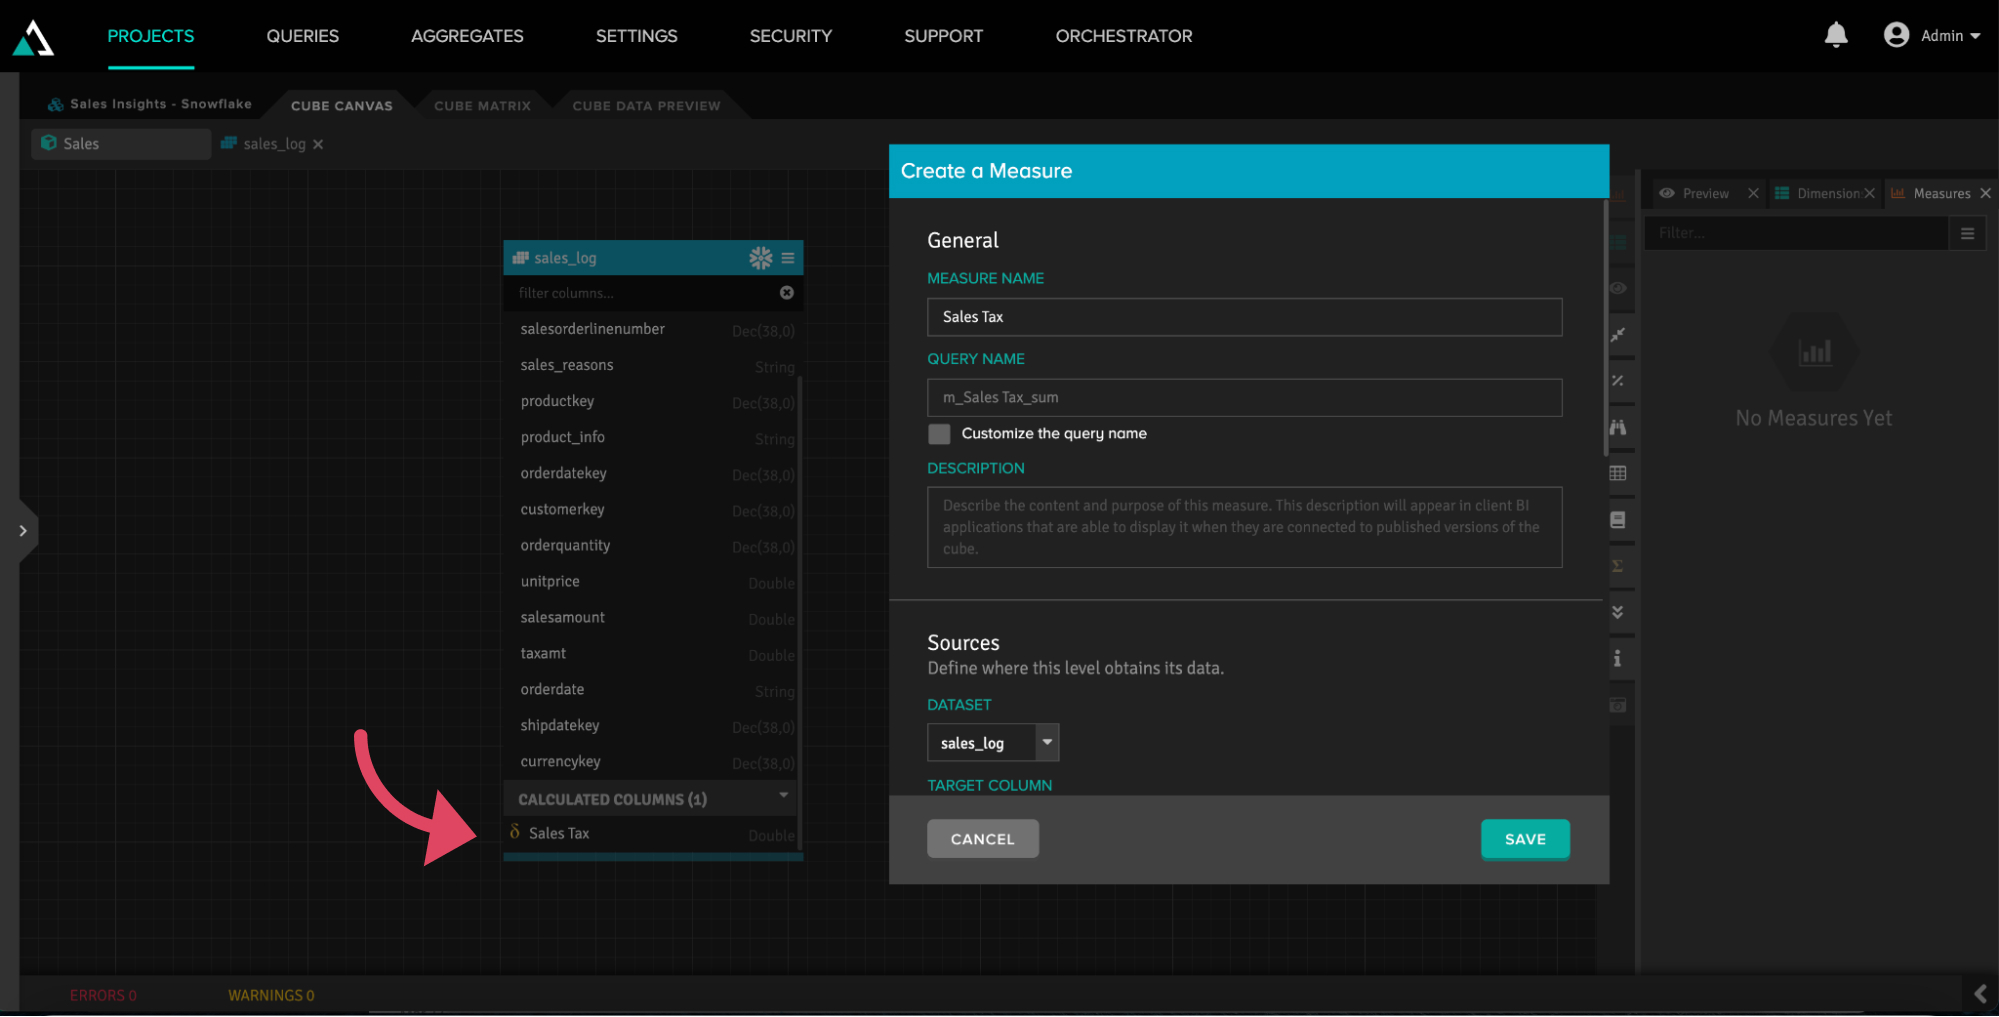
Along with adjusting data, you can create calculations that can be used in the semantic layer. For example, we can add a new column to calculate the sales tax for our sample sales data. These changes can be performed once and reused across different models.

Add metrics and dimensions
Once we’ve set up our semantic layer and model, we need to create metrics. By dragging our new sales tax calculation into the “Measures” panel, we’re adding a new metric that will be visible in our BI tools in a much cleaner and consistent format than the raw Snowflake data fields.
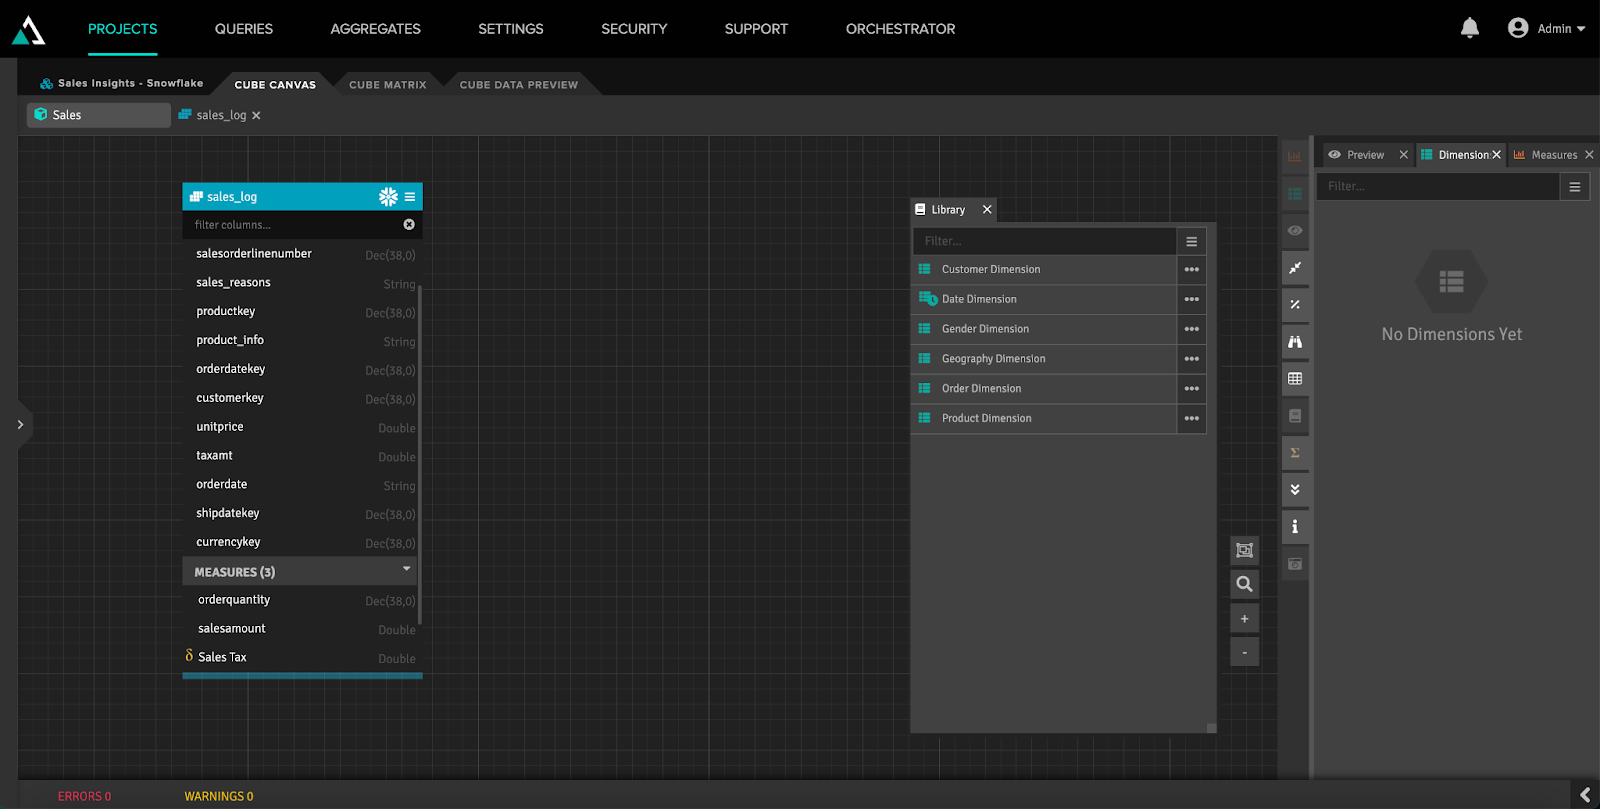
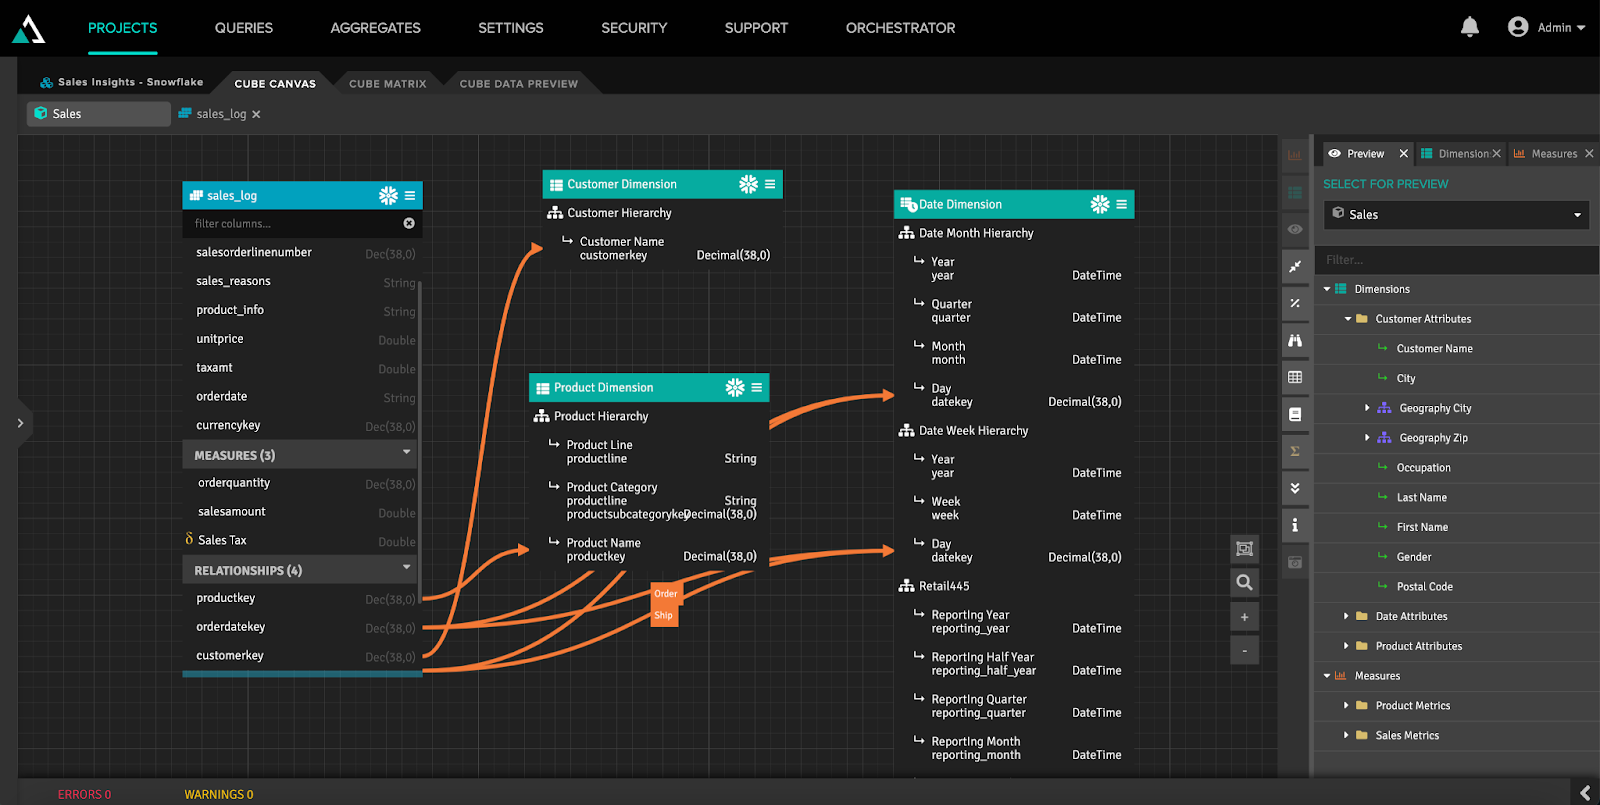
We can also include additional dimensions that will enable us to do pivots and other advanced manipulations. In our “Library,” we can see different data sets and dimensions, which can also be dragged into the canvas. As an example, we can include date, product, and customer dimensions for our sales log sample data.
For the additional dimensions to be usable, we need to connect them to our Snowflake data fields on the canvas. AtScale will automatically generate metadata when these relationships are made. This makes it much easier for you to get rich metadata and data hierarchies without any data wrangling.
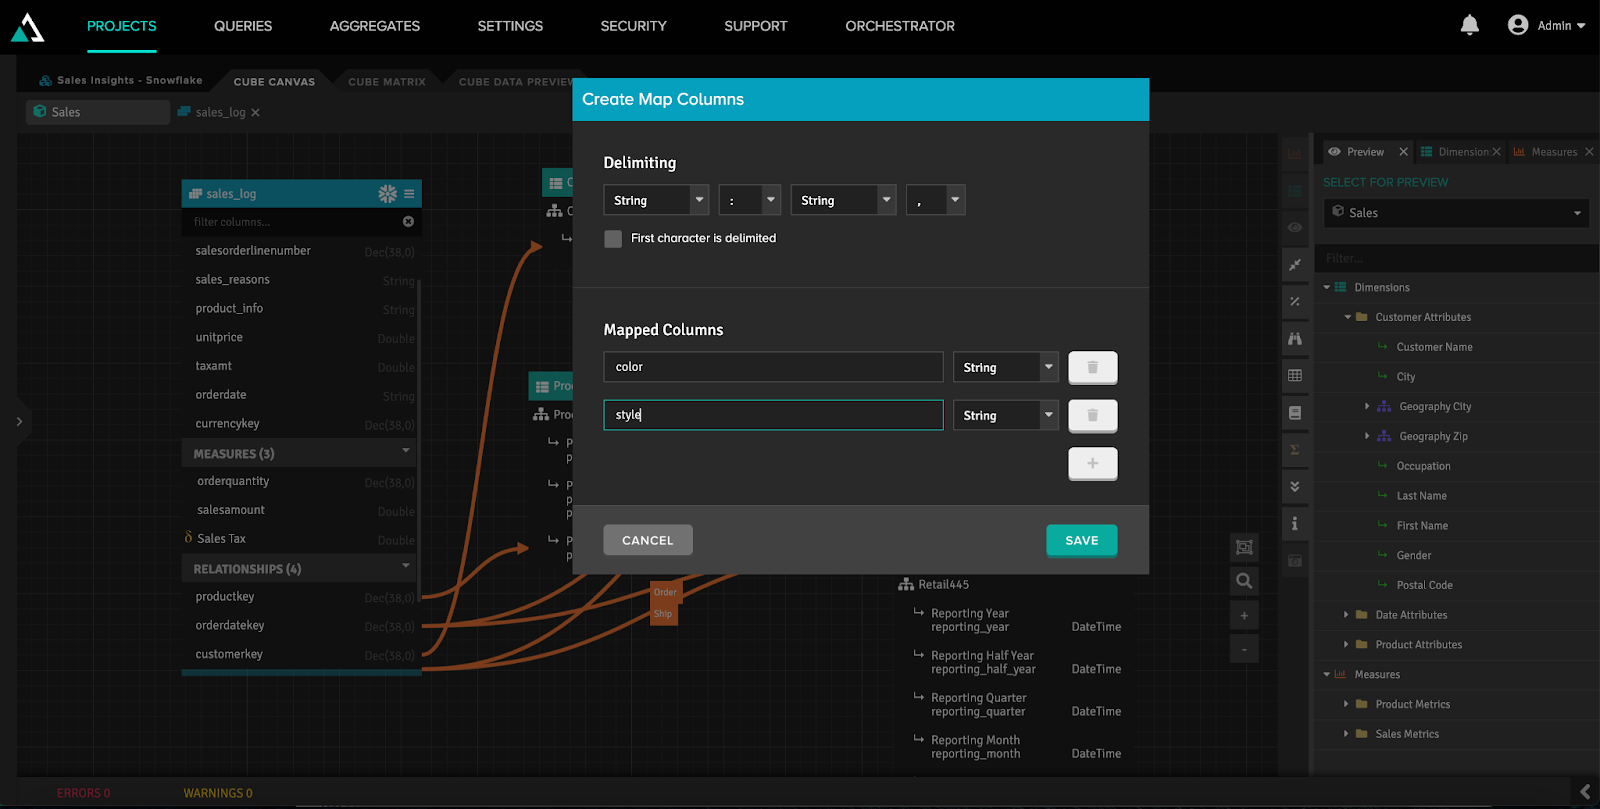
Another common situation with Snowflake is when there’s nested data, such as additional data within JSON or nested table fields. AtScale can understand these situations and map this nested data into separate virtual columns in the semantic layer.
When we’re finished creating our virtual model, we can click “Publish” to make it accessible for data consumers. This could be business intelligence users, data scientists, or nearly anyone else in the organization that wants to leverage this Snowflake data.
Consuming Snowflake data via the semantic layer
Once we have a published semantic layer for our Snowflake data, it’s straightforward to consume it using a variety of BI tools, ML Platforms, applications, and more. You can easily create a connection with Tableau, Power BI, and Excel to the AtScale semantic layer.
Tableau
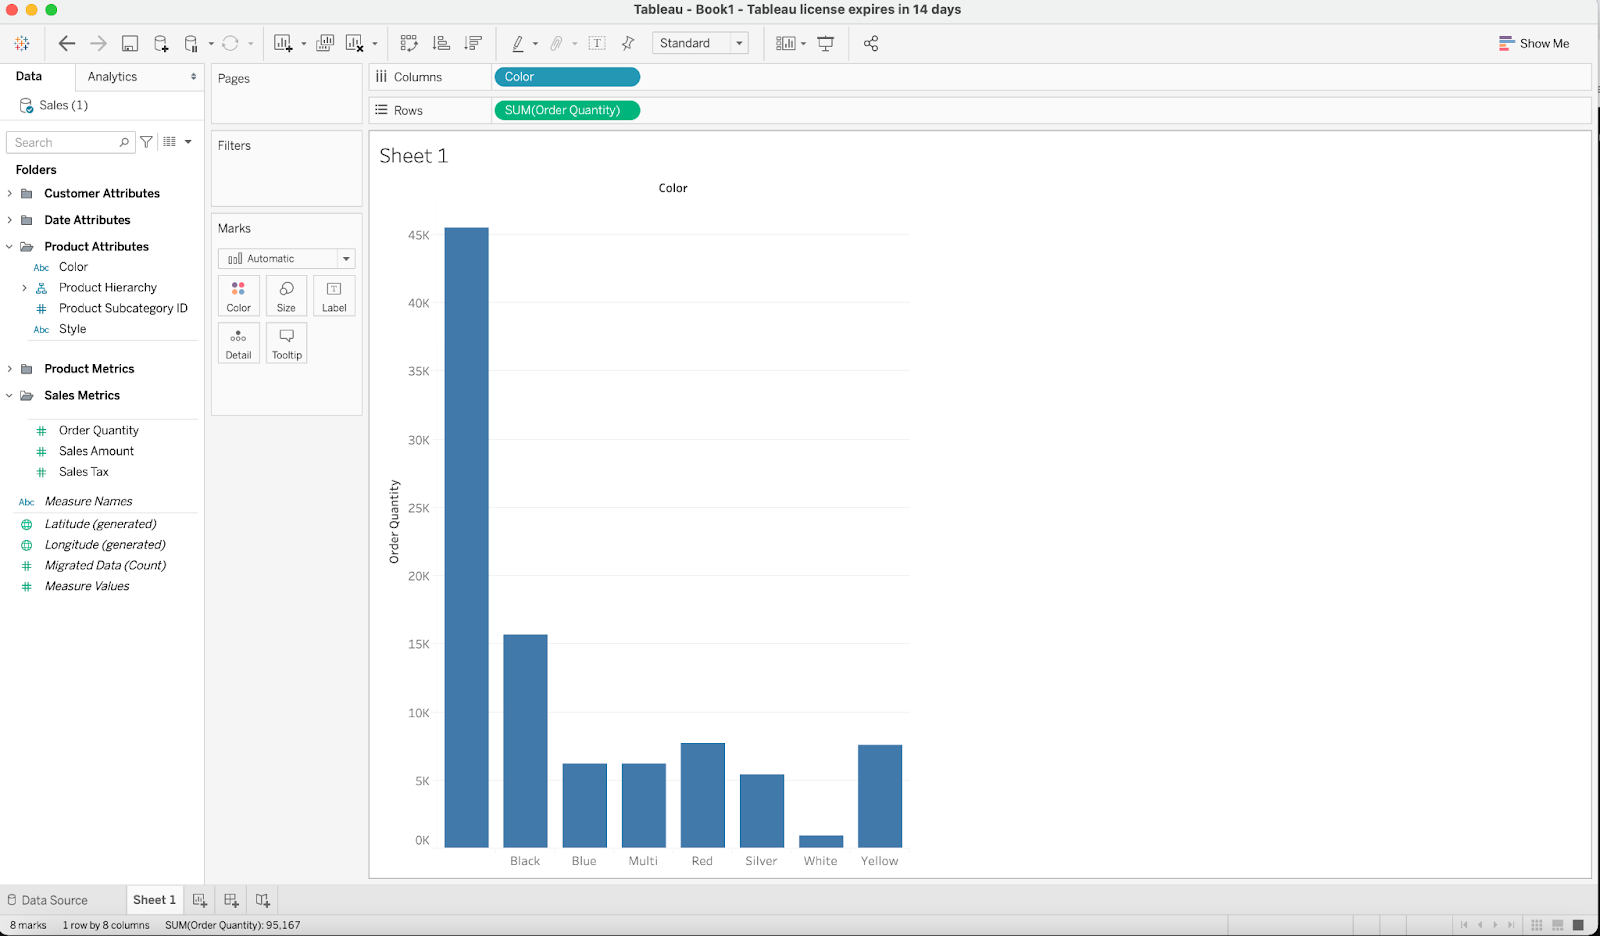
We can start by logging into our semantic layer directly from Tableau. Once we’re in Tableau, we can see all of the user-friendly metadata for the multidimensional model we just generated in AtScale. This isn’t a data extract or import, but a live connection to the data source, so any queries you run in Tableau will be immediately reflected in your Snowflake cluster.
Power BI
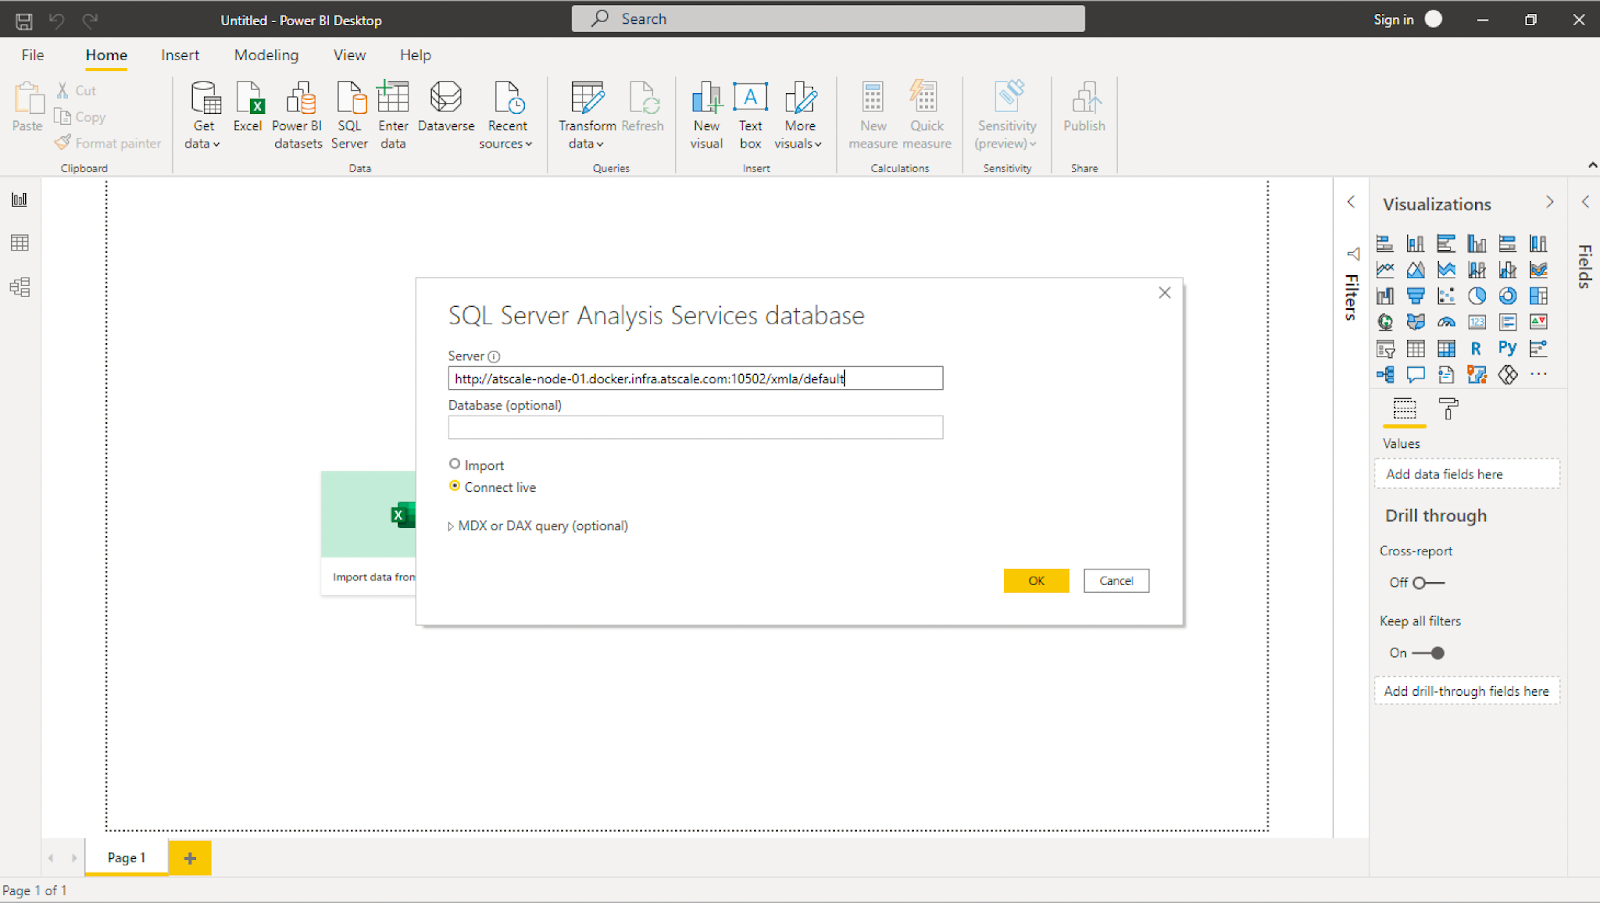
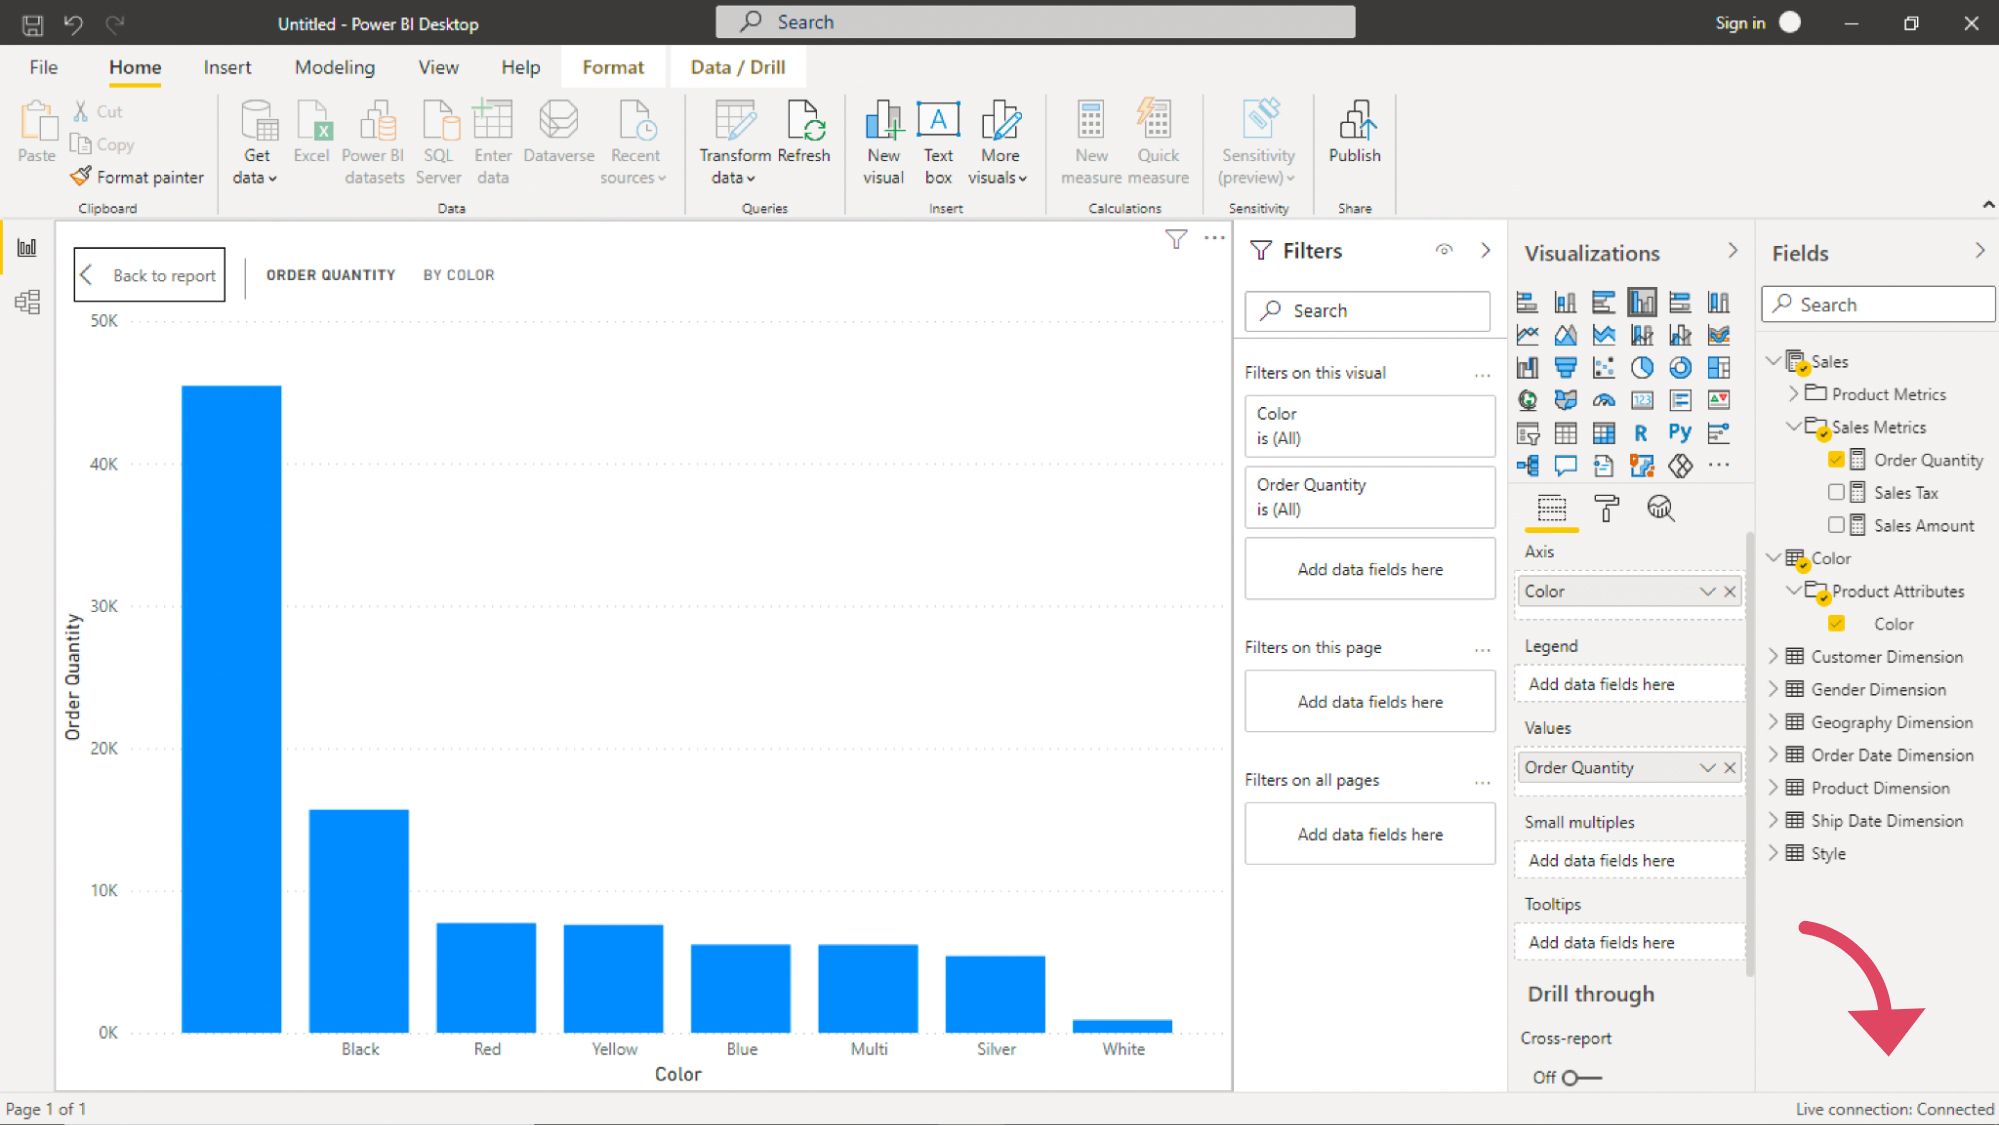
Similarly, we can connect directly to our AtScale semantic layer using the SQL Server Analysis Services (SSAS) driver. This will allow us to have a live connection to the virtual model we previously defined in the AtScale Design Center. You can now work with your Snowflake data without any remodeling effort.
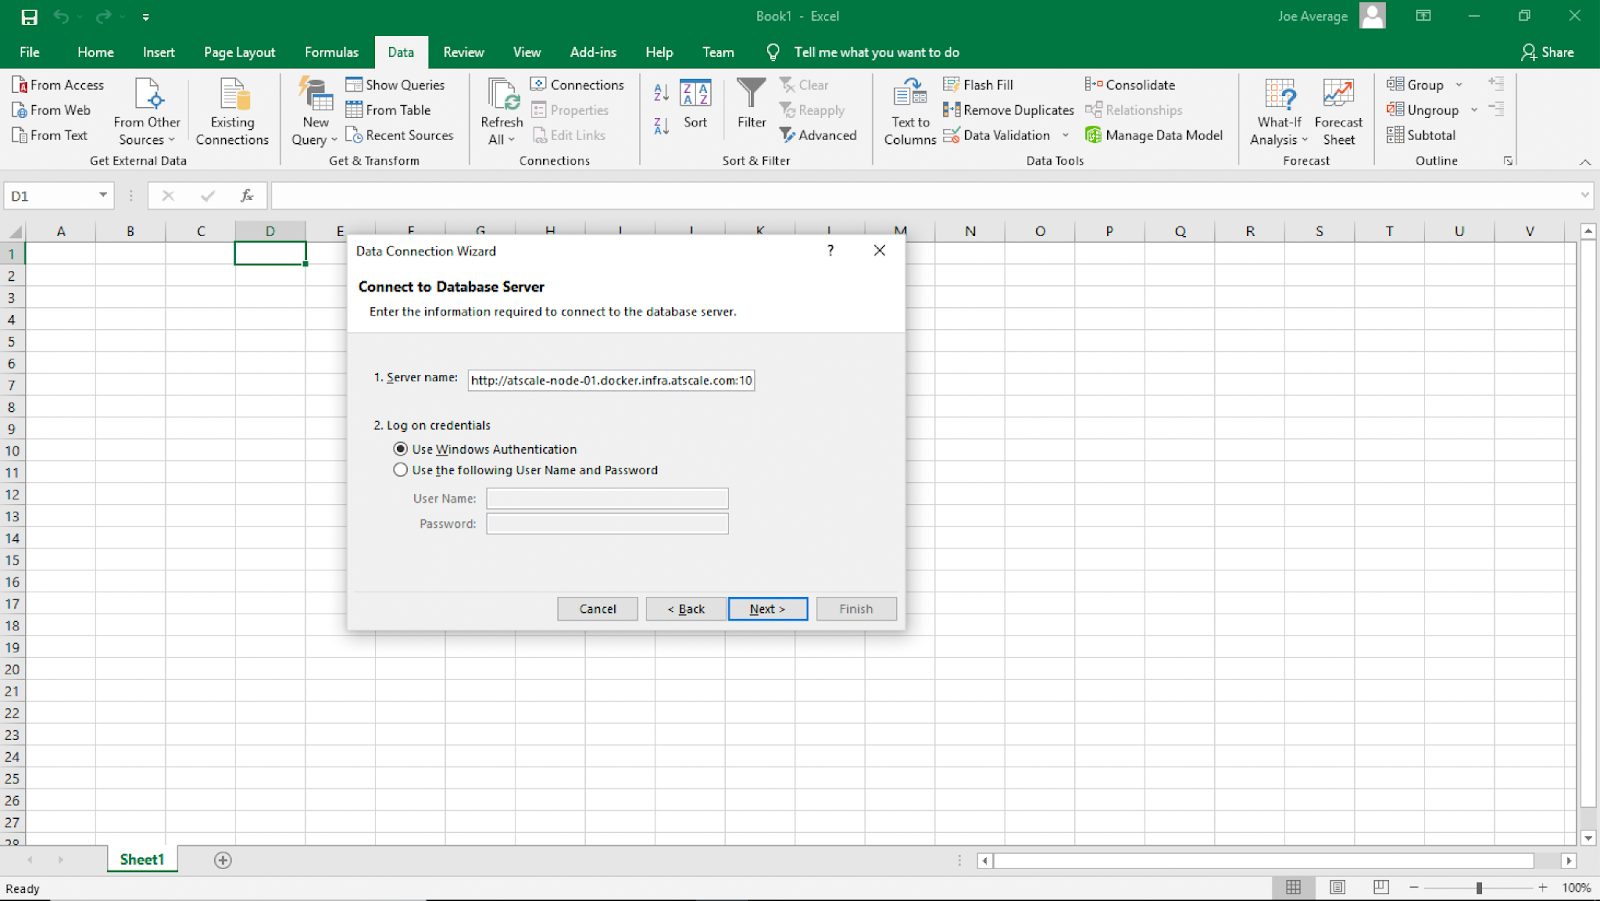
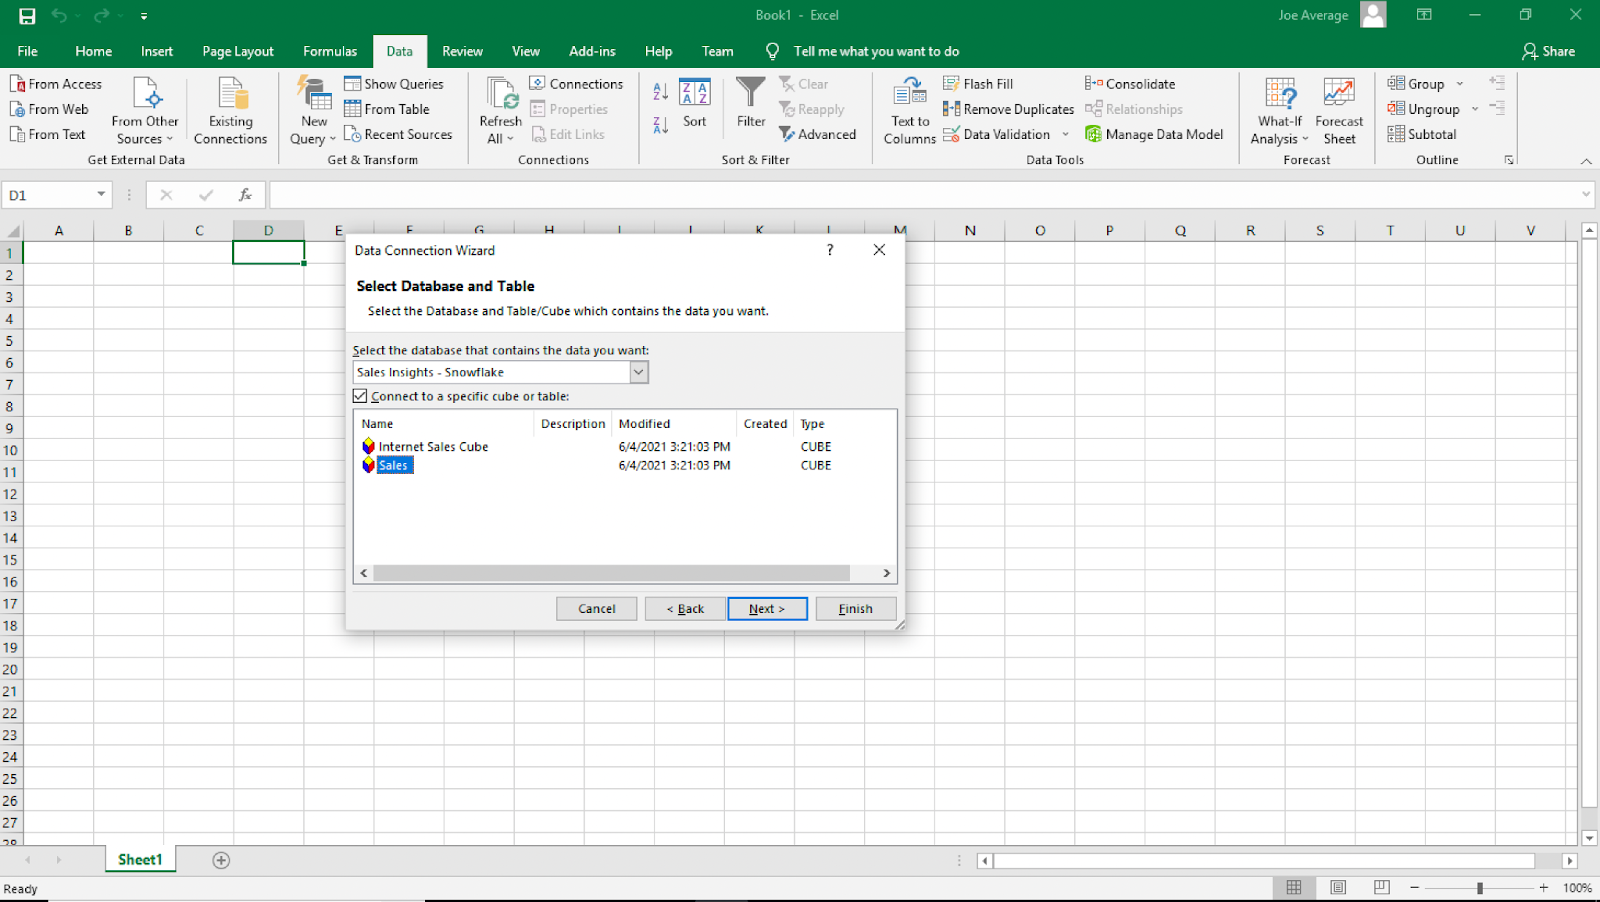
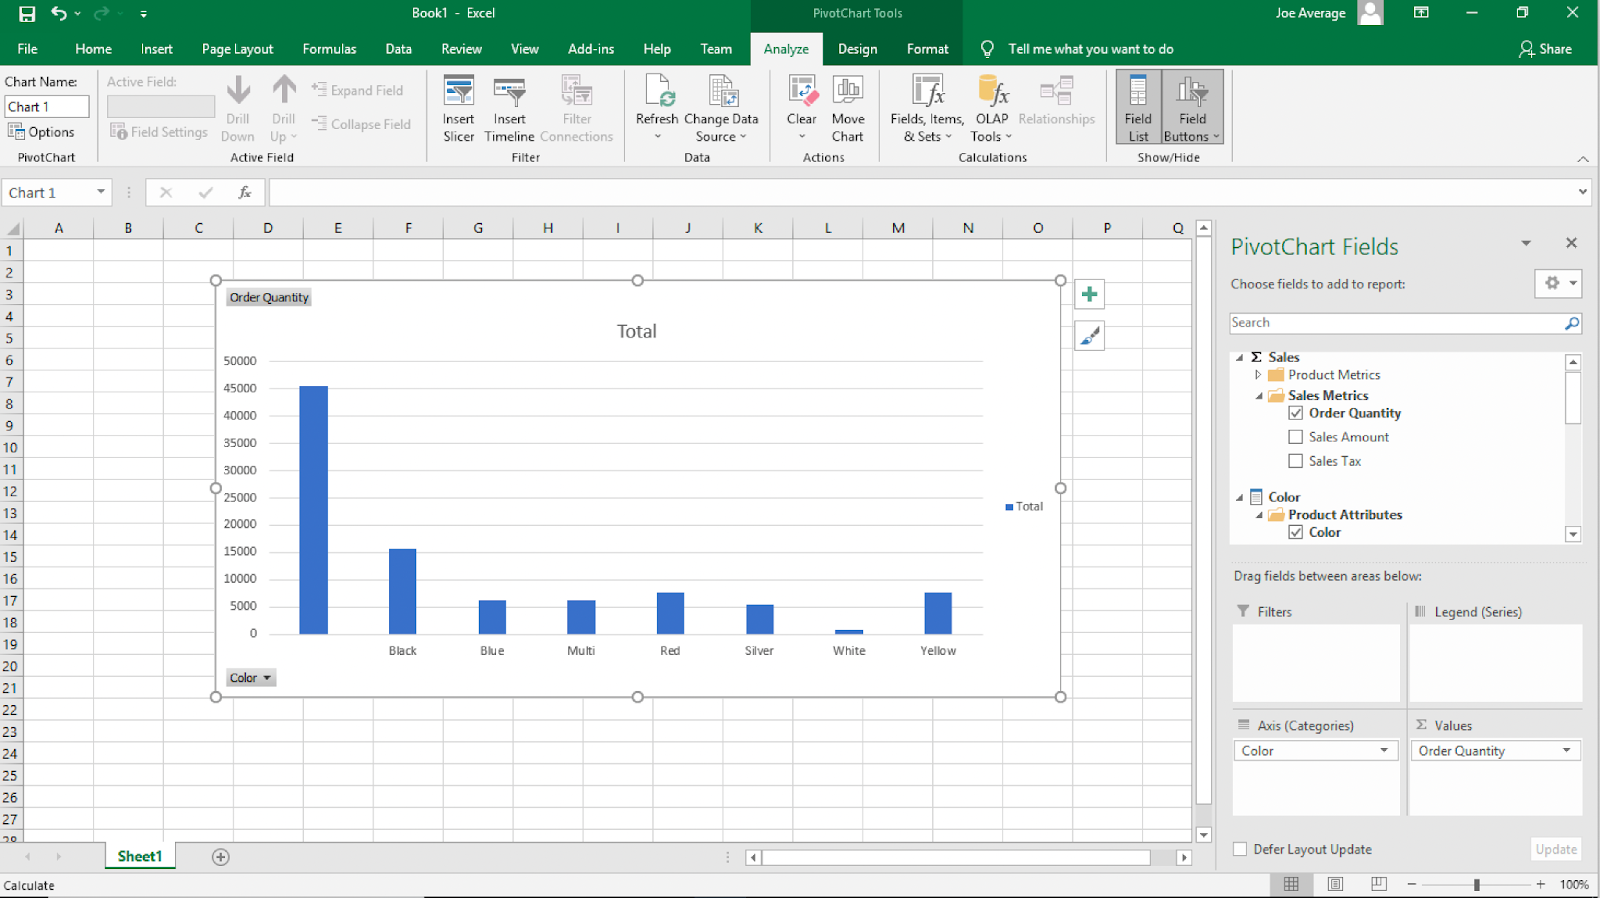
Excel
You can also access the virtual data model in Excel using its built-in capabilities, without installing any drivers. Windows Authentication also ensures that users can only access the data that they’re authorized to see. Similar to Tableau and Power BI, this is a live connection directly to the data stored in Snowflake.
Unlock your Snowflake data with AtScale
AtScale’s semantic layer creates consistency for data consumers across the organization. The metrics defined in AtScale will be available in Tableau, Power BI, and Excel. As users request data cuts in their BI tool, AtScale ensures live snowflake data is accessible in real-time and provides a consistent source of information.
In addition to governance and control, the semantic layer can also improve analytics performance and optimize Snowflake resource consumption. In fact, our benchmark analysis revealed that using AtScale with Snowflake accelerated query performance by 4x, driving 3.7x more queries for the same cost.
The combination of AtScale and Snowflake is forming the foundation of modern cloud analytics programs globally.
Want to learn more about AtScale for Snowflake? Watch our full demo here.
SHARE
Case Study: Vodafone Portugal Modernizes Data Analytics