This blog is part of a series from Tobias Zwingmann, Managing Partner at RAPYD.AI. RAPYD.AI lets you easily and quickly build fully-functional AI prototypes or AI MVPs powered by state of the art AI-services from Google, Amazon and Microsoft. Tobias has over 15 years of professional experience working in the corporate world where his responsibilities included building data science use cases, digital B2B products, and developing an enterprise-wide data strategy. He is also the author of the O’Reilly book, AI-Powered Business Intelligence (2022). Follow Tobias on LinkedIn and Twitter.
In today’s data-driven world, businesses are generating an overwhelming amount of data every day. The majority of companies are still relying heavily on their BI infrastructure to monitor their performance and make informed decisions. However, many companies have also set up data science teams to tackle the next frontier of data analytics.
With the help of modern data mining algorithms and machine learning models, data science teams want to understand what happened, why, what’s going to happen, and which actions the business should take.
Traditionally, data scientists and BI teams have operated independently, working on different infrastructures with distinct data paradigms and tools. However, this approach has too often led to even more data silos, inconsistencies, and duplicate efforts across organizations.
In this article, we’ll explore how data scientists can benefit from using BI tools and how they can work in tandem with BI teams to drive better business outcomes.
Let’s start by understanding the typical paradigms of BI and data science teams.
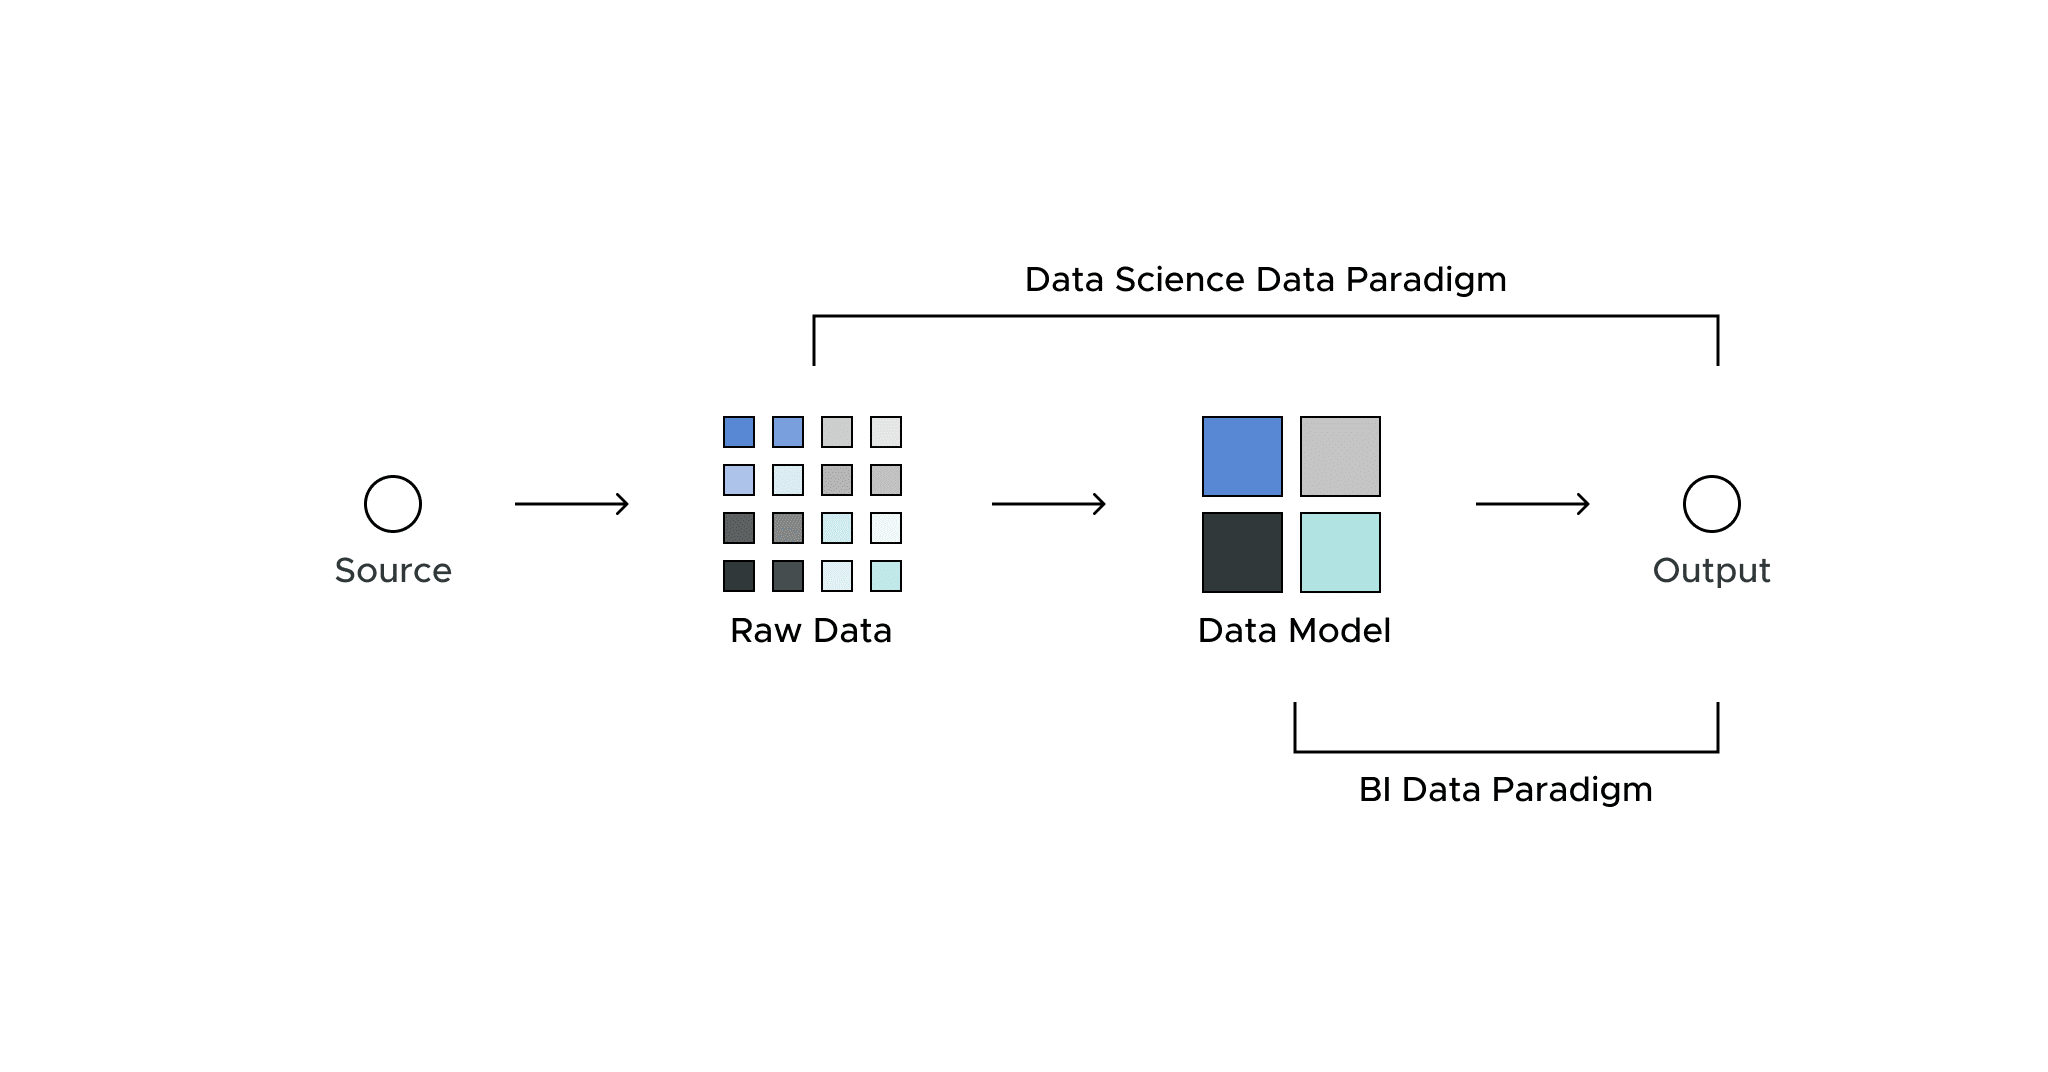
The BI Data Paradigm
The BI data paradigm is characterized by a focus on predefined key performance indicators (KPIs) and metrics. This approach requires a well-defined data model and schema, which is a fixed reference point.
BI tools then use this schema to create reports and dashboards that provide an overview of business performance. This overview is typically for business leaders and analysts from different business domains and units. This approach gives them a standardized view of their previously agreed upon relevant performance metrics.
However, this process has its limitations.
Data scientists often find the predefined schema too restrictive and cannot extract the insights they need to build effective models. Data is often only available at a highly aggregated level, and data scientists can only access the drill downs that were previously defined in the data cube. This data is typically not suitable for more advanced analytical tasks such as predictive analytics.
The Data Science Data Paradigm
The data science data paradigm is generally based on the idea of working with raw data as close to the source system as possible.
With this raw data, data scientists can create customized models and run algorithms that provide deeper insights. But it also requires data scientists to do a significant amount of data preparation and cleaning. This brings in great challenges.
Data scientists must understand the business context and be able to comprehend the logic behind the metrics and KPIs used in different areas of the business. They also need to validate the interpretation of their models against those business metrics, which can be a time-consuming process.
For example, if a data scientist is trying to model a customer’s buying behavior, they need to understand both the business logic behind a customer entity and a purchasing event. What sounds trivial in theory can be an increasingly complicated task, even for mid-sized companies.
In summary, the data science approach allows for more flexibility and creativity. However, it can also lead to even more data silos and models that are disconnected from the BI unit.
Bridging the Gap: How Data Scientists Can Benefit From BI
While there are fundamental differences between these paradigms, there are also many effective ways data scientists can leverage BI infrastructure to create more business value.
Here are some of those key strategies:
1. Data Quality and Governance
If there is one area where traditional BI systems can typically ace, then it’s data quality and data governance. Thanks to the static data schemas and inflexible data models, BI teams typically have well-established processes for data and analytics governance and quality, including data validation, metadata management, and data lineage.
If there’s a KPI for last quarter’s revenue somewhere on your BI dashboard, someone in your organization should be able to tell you how this KPI was calculated, as well as which assumptions were made in this case and why.
These underlying data governance and data lineage processes can act as guardrails for data scientists to repurpose for their own processes.
For example, if a data scientist wants to come up with their own logic for creating a business metric, they should be able to explain how (and why) this metric differs from the one used in the BI system.
Existing data governance standards can be used to document these decisions and allow for better overall integrity, ensuring that data is interpreted in the right way. That helps businesses draw the correct conclusions.
2. Access to Users
Enterprise-wide BI platforms such as Tableau, PowerPoint, and even Excel in many cases, are often the main interfaces through which users look for data, insights, and actionable advice.
Although many data scientists will want to develop their own interfaces around their models, they should develop a strategy for how their work can be visible in the BI tools.
Getting users to adopt a new tool for their work is difficult not only for the consumer but also for the enterprise. Most people are used to the tools they use on a daily basis. Why reinvent the wheel and avoid the platforms that users already rely on regularly?
In many cases, it’s much better to make the results of a predictive model (such as a customer churn risk table) available as another table in Microsoft Excel or Power BI instead of building another Streamlit app. Adding another tool to the mix just complicates the process.
However, some data science use cases may have more advanced requirements for user interactions and therefore require a more flexible framework than typical BI platforms can provide. But even in these cases, it may be worth checking the capabilities of your BI tools beforehand.
Many platforms allow custom plugins or script integrations for popular data science languages, such as Python and R. The integration might be a bit more complex for the data science team, but it ensures that they’re building for a platform that already has some user adoption in the enterprise.
By working towards a common space for dashboards, reports, and “all things data,” data scientists can more effectively collaborate with business analysts and leaders. This helps them effectively leverage their work across the organization.
3. Quick Access to Data
One of the biggest hurdles for data science teams is getting access to key source data systems. These hurdles include not only technical challenges — which are usually the easiest to solve — but also (more importantly) non-technical aspects, such as access policies and user rights management.
It’s not uncommon for a newly hired data scientist to have to wait a few weeks, sometimes months, to gain access to critical systems and for all internal forms to receive proper approval. To minimize the waiting time for getting access to source systems, data scientists can leverage existing BI infrastructure to smooth out the entire process.
BI systems already have built-in connectors to key enterprise data source systems, making it easy for data scientists to get up and running quickly from a technical perspective. Also, BI systems typically have existing approval and IAM processes for onboarding new (technical) users.
While the data in the BI platform may not be 100 percent in line with what a data scientist might need, it’s a great way to get an initial sense of what source systems are considered relevant by the organization. That way, data scientists can see how these data sources are currently being used for reporting and monitoring. Then it’s easier to ask for specific access to selected source systems.
By starting with existing BI reports and dashboards, data scientists can understand business metrics and the logic behind them. This helps them set the right foundation for building models in line with existing business metrics and goals.
4. Feature Engineering
In legacy BI systems, data is often only available in a predefined, aggregated form, and it’s often not possible to “de-aggregate” the data within the platform itself.
Modern BI systems, however, which use a semantic layer between raw data in the cloud data warehouse and aggregated data for BI reporting, allow users to navigate more seamlessly between both extremes.
For example, data scientists could take a monthly aggregated KPI and break it down to a daily level in the BI tool. From there, they would be able to access the SQL query that generates these daily aggregates directly from the raw data in the underlying cloud data warehouse. That way, data scientists can conveniently choose the level of abstraction they need and make decisions about deviating from this predefined logic.
This approach allows data scientists to stay within the existing framework of KPI governance and customize or unpack the KPIs needed for predictive modeling.
To make BI data even more accessible to data scientists, organizations can use R and Python connectors, making programmatic access to the BI platform even easier from any preferred development environment.
Once data scientists adopt the “working backwards” instead of “building upwards” mentality of preparing data for their predictive models, they will not only face better alignment with the business and BI organization, but also benefit from all (technical and non-technical) infrastructure that was built around the BI platform.
5. Performance Management
Lastly, data science teams — especially the ones organized as separate business units — should try to use existing BI infrastructure for their own reporting purposes.
For example, when there is a reporting dashboard of various predictive models in production, they can integrate this dashboard into the BI platform.
This way, data scientists themselves become users of the BI platform and can use it to identify performance issues, optimize algorithms, and improve the accuracy of their models. It also helps data scientists easily share insights around their models with other stakeholders in the organization.
Bridging Data and Business With BI Infrastructure
Data scientists can benefit greatly from leveraging the BI infrastructure to contribute more to the business. By understanding the BI platform as the primary interface for business users, data scientists can make their own workflows more efficient and also leverage existing policies for data governance and data quality.
At the same time, BI platform operators must embrace that they both cater to analysts that want to look at predefined metrics with some custom self-service deep dives — and offer the whole range of flexibility to reproduce any level of data granularity as needed.
To fully leverage a common infrastructure that meets both paradigms, the technical platform must allow data scientists to work with the same data sources as the BI team. That platform must be flexible enough to access raw data close to the source, reflect the granularity needed for advanced analytics tasks and provide an integrated framework for data governance and data lineage.
Want to learn more about bridging the gap between business and data teams with BI? Check out these four best practices to bring these disparate teams together.
SHARE
2026 State of the Semantic Layer