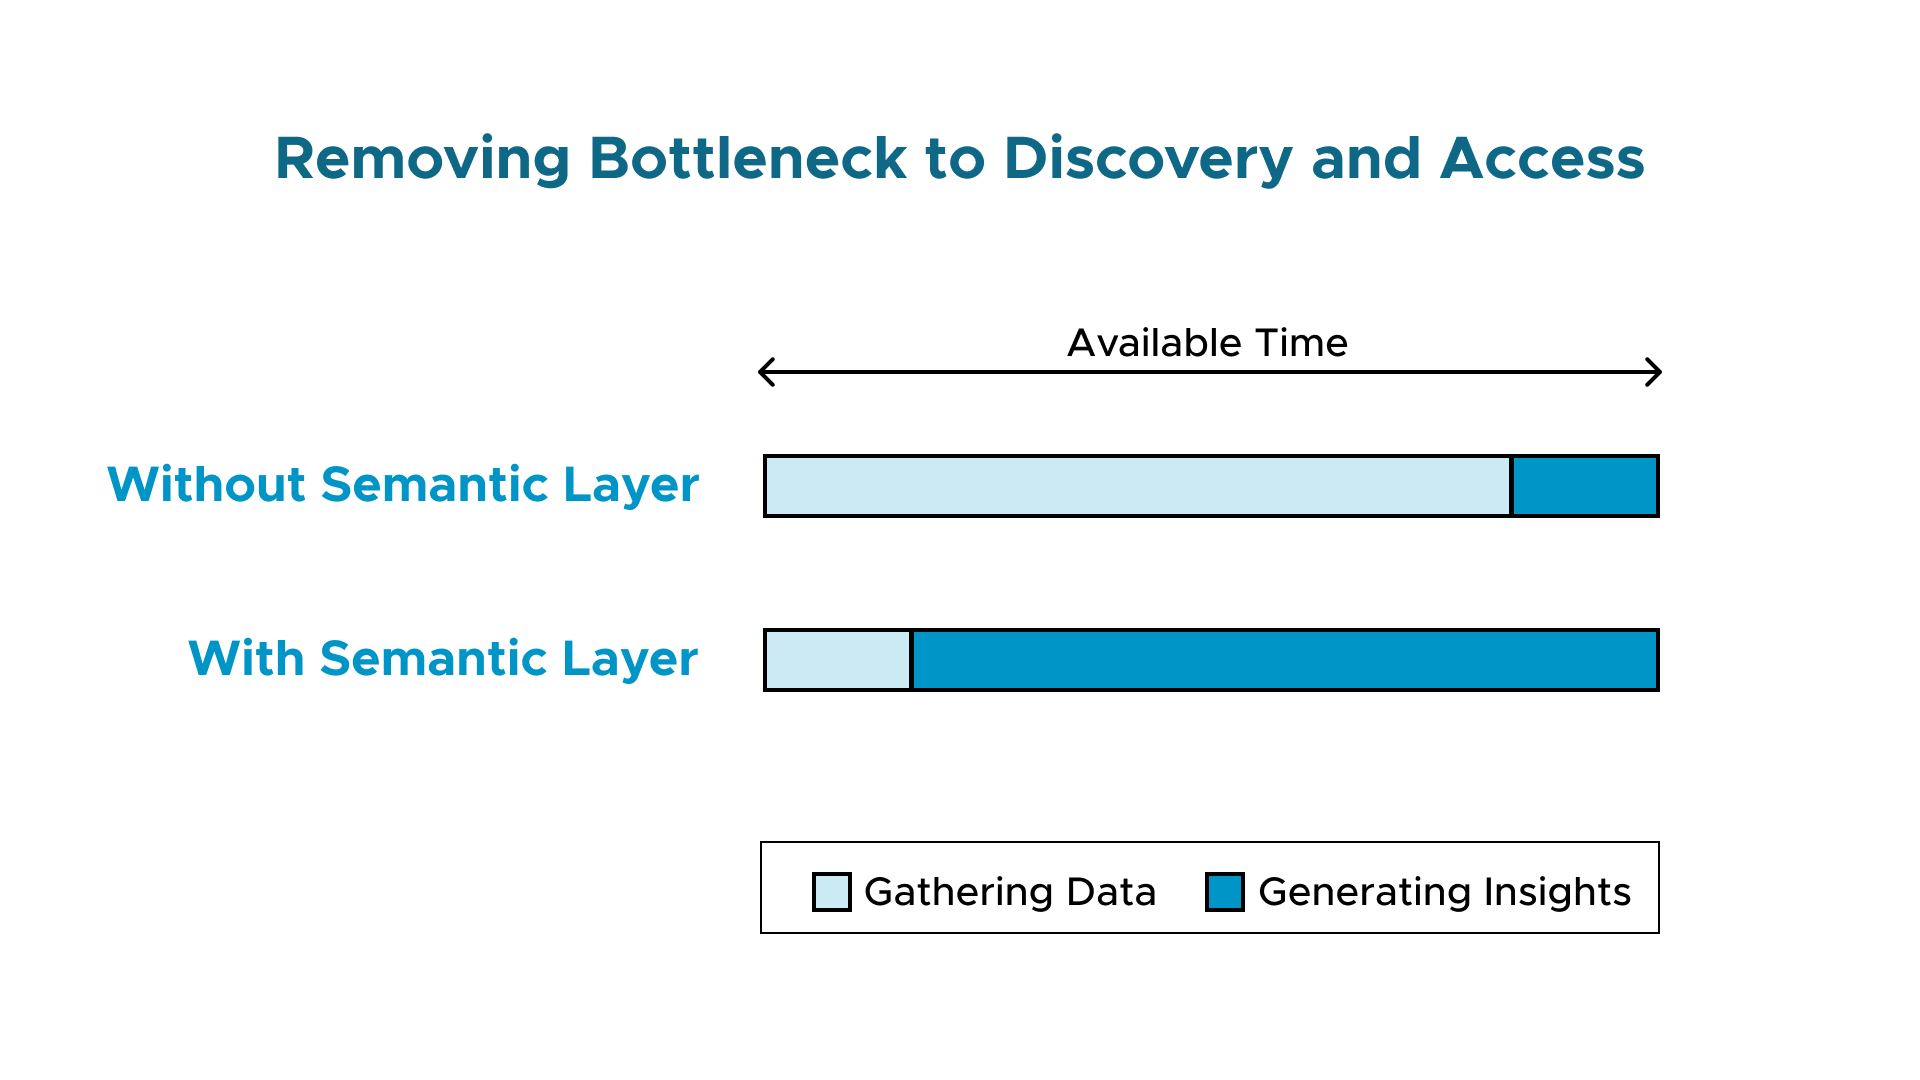
AtScale’s semantic layer platform makes data more accessible and business-friendly, and bridges the gap between business intelligence (BI) and data science teams. A semantic layer presents a consistent set of business metrics for teams across your organization to enable everyone to use the analytic tools that they are comfortable using. The AtScale semantic layer delivers data governance and security, eliminating data copies and the risks associated with them. In addition, AtScale’s semantic layer accelerates end-to-end query performance while optimizing cloud resources.
In this blog, we will dive deeper into the benefits of a semantic layer platform, show how AtScale is architected, and give you a walkthrough so you can see how it works.
Where Does AtScale’s Semantic Layer Platform Fit in the Stack?
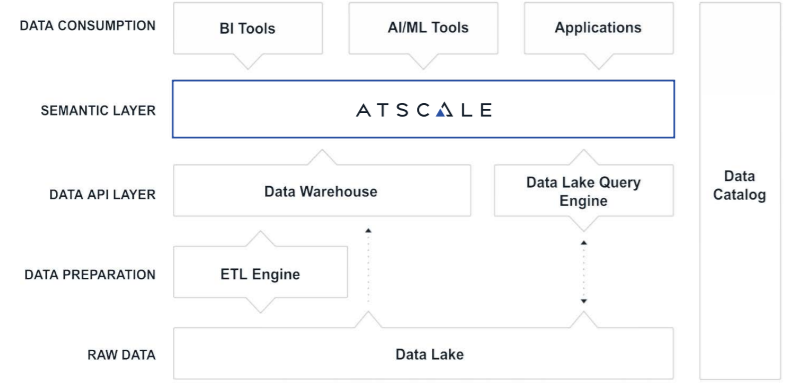
AtScale’s semantic layer platform blends data and provides a single source of the truth by sitting between your consumption tools and your data platforms. AtScale makes data stored in data lakes or data warehouses accessible and offers integrations with enterprise data catalogs that makes data discoverable.
Whether you are using Snowflake, Google BigQuery, Amazon Redshift, Azure Synapse SQL, or accessing a data lake with engines like Databricks SQL, Spark or Impala, AtScale will deliver speed of thought performance while allowing users to leverage the BI & AI tools they know and love.
In addition, your data scientists have the ability to write back to the semantic layer, generating and modeling new predictions and features, and then sharing those new insights with other data scientists and business stakeholders.
AtScale’s Semantic Layer Platform Capabilities & Components
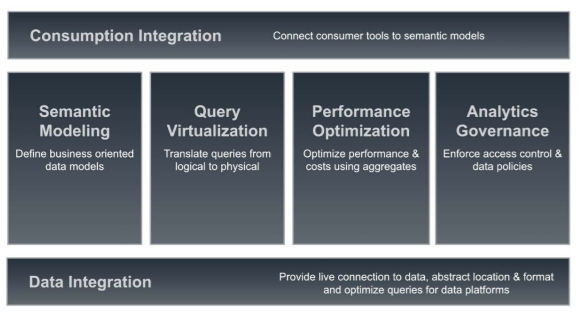
AtScale’s semantic layer is powered by the capabilities and components outlined in the figure above.
First, AtScale integrates with consumption tools using their native protocols. In addition to SQL, tools like Power BI connect live to AtScale using the built-in Data Analysis Expressions (DAX) driver. Excel connects to AtScale using the built-in Multidimensional Expressions (MDX) driver and AI/ML tools connect using Python. These protocols connect live to your data, eliminating the need for data extracts and imports.
Second, the data integration layer connects live to the data platforms regardless of where they live using native SQL that is optimized for each data platform dialect.
Next, the semantic layer is powered by a dimensional semantic model that creates a business-friendly view on top of your raw data. This logical data model makes data access easy for everyone in your organization, not just data engineers or data wranglers.
AtScale also acts as a query virtualization engine, presenting a logical, abstracted view of data to your consumers, and then translating that logical view into physical queries. Those queries also take advantage of performance optimization when the AtScale engine automatically creates and modifies aggregate tables. These aggregates or materialized views are created directly on the source data platform, optimizing queries by avoiding costly table scans, as well as governing access to every query based on RBAC controls.
AtScale’s Semantic Layer Platform Architecture
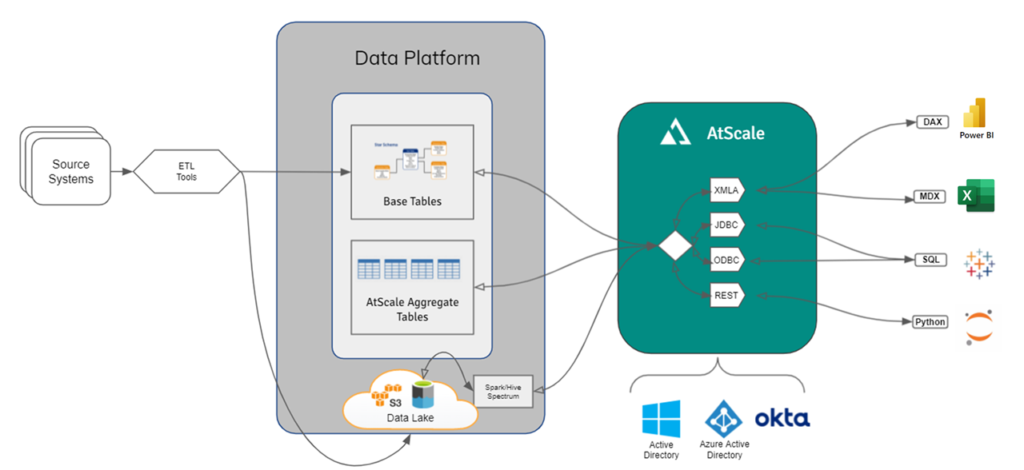
The image above shows an example architecture with the AtScale semantic layer included. On the left you have your data platform and ETL tools, which can be anything from a cloud data warehouse to a data lake. In the center is the AtScale semantic layer platform where your consumers, using their BI or Ml tools, connect with their native protocols. As a universal semantic layer, AtScale can take advantage of tool-specific native protocols using the XMLA, JDBC, ODBC, and REST interfaces to create live connections to your data platforms.
AtScale Product Walkthrough
Let’s see how all of this works. The image below shows the AtScale Design Center. This multi-user, browser-based environment is where we create and manage our models. For example, this finished model happens to be using Snowflake showing sales data from our web store.
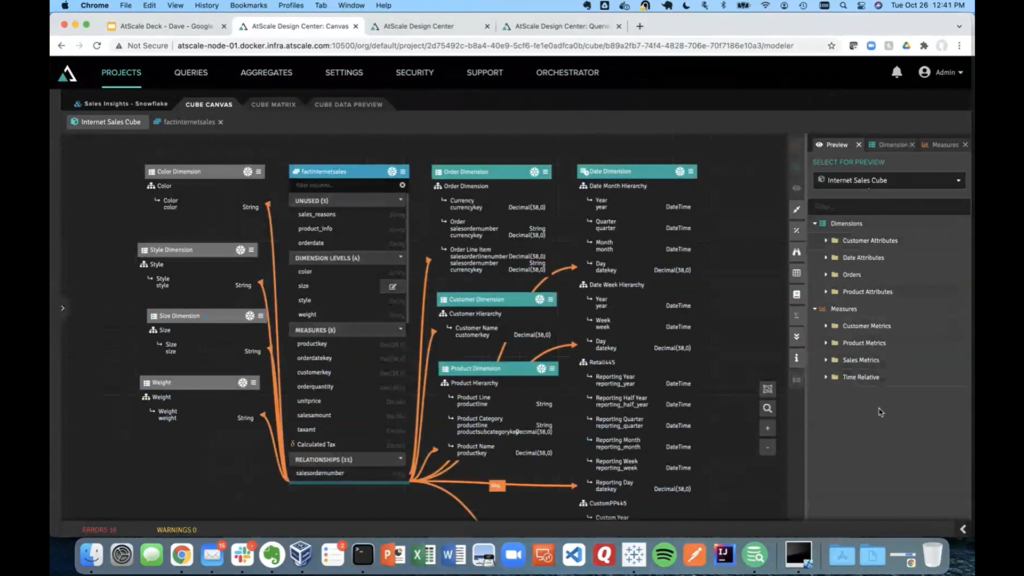
Below shows our objects such as tables and conformed dimensions which are used to define our models.
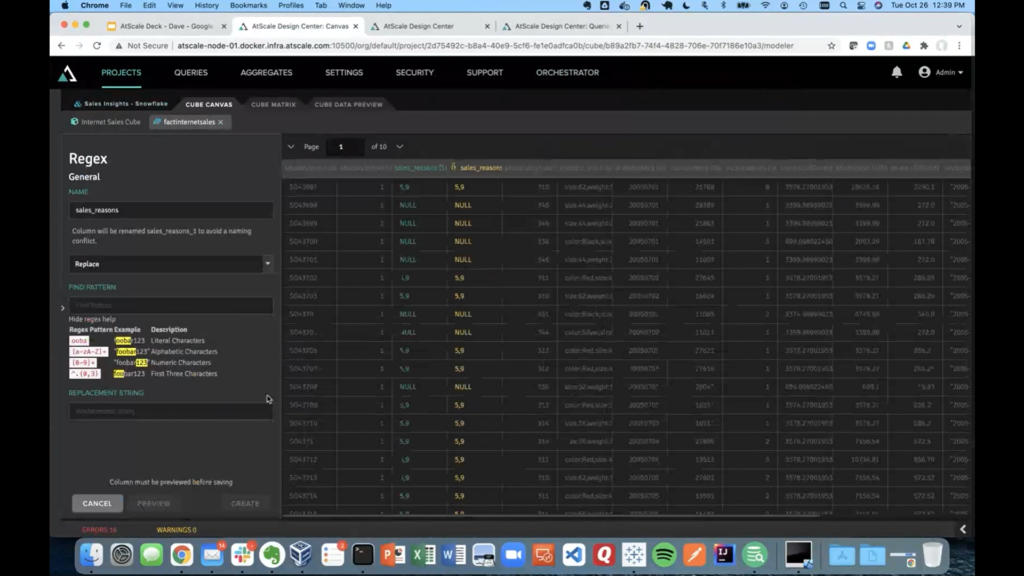
In addition, I can double click a dataset (blue box) to see our raw data, create transformations and enhance it with additional calculations. As you can see below, we can replace our NULL values with another string to clean up our data virtually, without ETL or data movement.
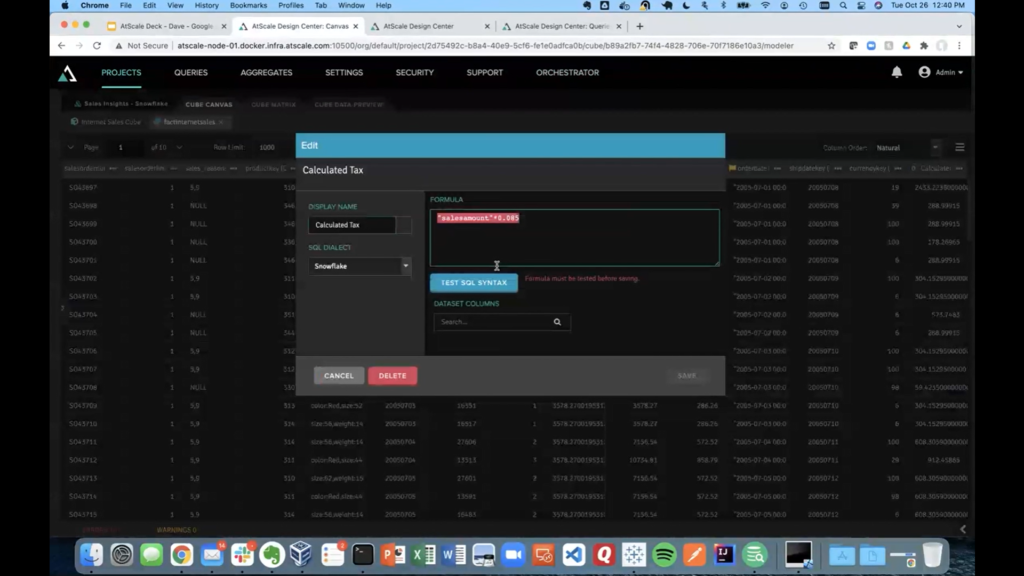
You can also create different calculations like below which shows a formula for calculating tax using the SQL dialect of the native platform (Snowflake SQL for this use case).
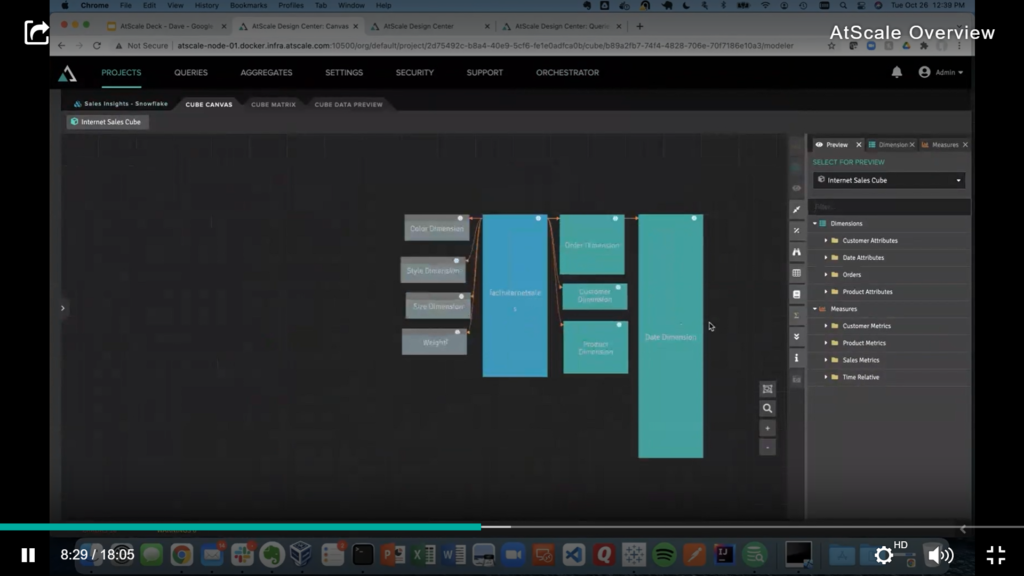
You create your models manually using the AtScale Design Center Cube Canvas or import models from Tableau, SSAS or XML to create models automatically.
On the right side of the AtScale Design Center canvas, we can see our model Preview, Measures and Dimensions panels. The Preview panel shows the business-friendly metadata (logical view) that will appear in our consumer tools and applications.
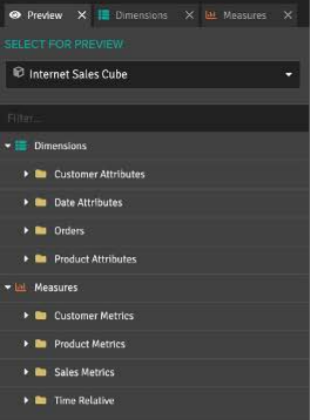
Let’s see how this data looks in various BI tools starting with Tableau! Below we are connected to the Internet Sales model that we defined in the AtScale Design Center canvas. With this business-friendly view of our metrics, dimensions, hierarchies and folders, we can run live queries like “Order Quantity by Product Name” as seen below.
Let’s now see how the same semantic model looks in Excel. Using the built-in Analysis Services connector, we can connect live to that same Internet Sales Cube and now run queries using MDX. Not only can you create live pivot tables and charts like we see below, but this also works with Excel’s cube value functions. This means that each cell in this worksheet can connect to each cell in the logical semantic model.
Finally, let’s see how the semantic layer works with Power BI. With no extra driver to install, we can connect live to the data using the SQL Server Analysis Services (SSAS) URL. You see that AtScale’s model is being inherited by Power BI automatically, freeing your users from needing to model the data locally in Power BI. In addition, you can see how the AtScale semantic layer for the “Internet Sales Cube” appears to consumers in Power BI.
If we go back to the AtScale Design Center’s Query Log screen, we can see what AtScale was actually doing in the background with these queries. In this screen, you are able to see the exact queries and aggregates used by each query.
In summary, the AtScale semantic layer platform delivers live and governed access to data in a business-friendly interface. AtScale will continuously optimize queries to provide user-friendly access to data for everyone in your organization.
SHARE
Whitepaper | Enterprise Semantics for Power BI