In the world of Business Intelligence and Big Data there continue to be a number of exciting innovations as new and improved options for processing large data sets appear on the market. You may be familiar with AtScale’s BI-on-Hadoop Benchmarks – where we focus on evaluating the top SQL-on-Hadoop engines and their fitness to support traditional BI-style queries. As we continue to work with customers who are navigating their journey to BI on Big Data, we are increasingly getting questions about the emerging cloud-based data processing engines.
In this blog post, we will take a deeper look at BigQuery from Google, and how it stacks up in the BI-on-Big Data ecosystem.
The AtScale BI on Big Data Benchmarks consider the following core elements when evaluating how well different SQL engines satisfy Business Intelligence workloads:
- Performs on Big Data: the database engine must be able to consistently analyze billions or trillions of rows of data without generating errors and with response times on the order of 10s or 100s of seconds.
- Fast on Small Data: the engine needs to deliver interactive performance on known query patterns return results in no greater than several seconds on small data sets (on the order of thousands or millions of rows).
- Stable for Many Users: Enterprise BI user bases consist of hundreds or thousands of data workers, and as a result the underlying query engine must perform reliably under highly concurrent analysis workloads.
As you will read below, the results of our AtScale + Google BigQuery showed great promise. Some highlights from our efforts include…
- Ease of data loading: the process of moving our data set to the cloud and loading it into BigQuery was simple and well-documented.
- Simple query tools: the management console, query tools, and documentation make the product easy to use and support rapid on-boarding.
- Out-of-the-box performance: the engine performs quite well “out-of-the-box”, requiring minimal query tuning and no system configuration.
- Impressive concurrency: The serverless model means concurrent query performance on small data sets shows no query degradation, even at query volumes above 25 concurrent BI users.
Benchmark Data Set Described
As a reminder, our previous benchmarks looked at SQL-on-Hadoop engine performance against a 6 Billion row data set fashioned after the Star-Schema Benchmark (SSB) schema; described in greater detail here.
This benchmark data set is based on the widely-used TPC-H data set and has been modified to more accurately represent a data layout (in the form of a star schema) that is common for business intelligence workloads.
For the BI on Big Query Benchmark we used a large scale version of the SSB data set, with a focus on testing queries across large tables: the LINEORDER table contains close to 6 billion rows. Additionally, because big data sets often include dimension tables with very high cardinality we also expanded the size of the CUSTOMER table to over 1 billion rows.The schema and row counts for each of the tables used in the BI benchmarks are shown below.
Figure 1: BI on Big Query Benchmark Schema and Row Counts 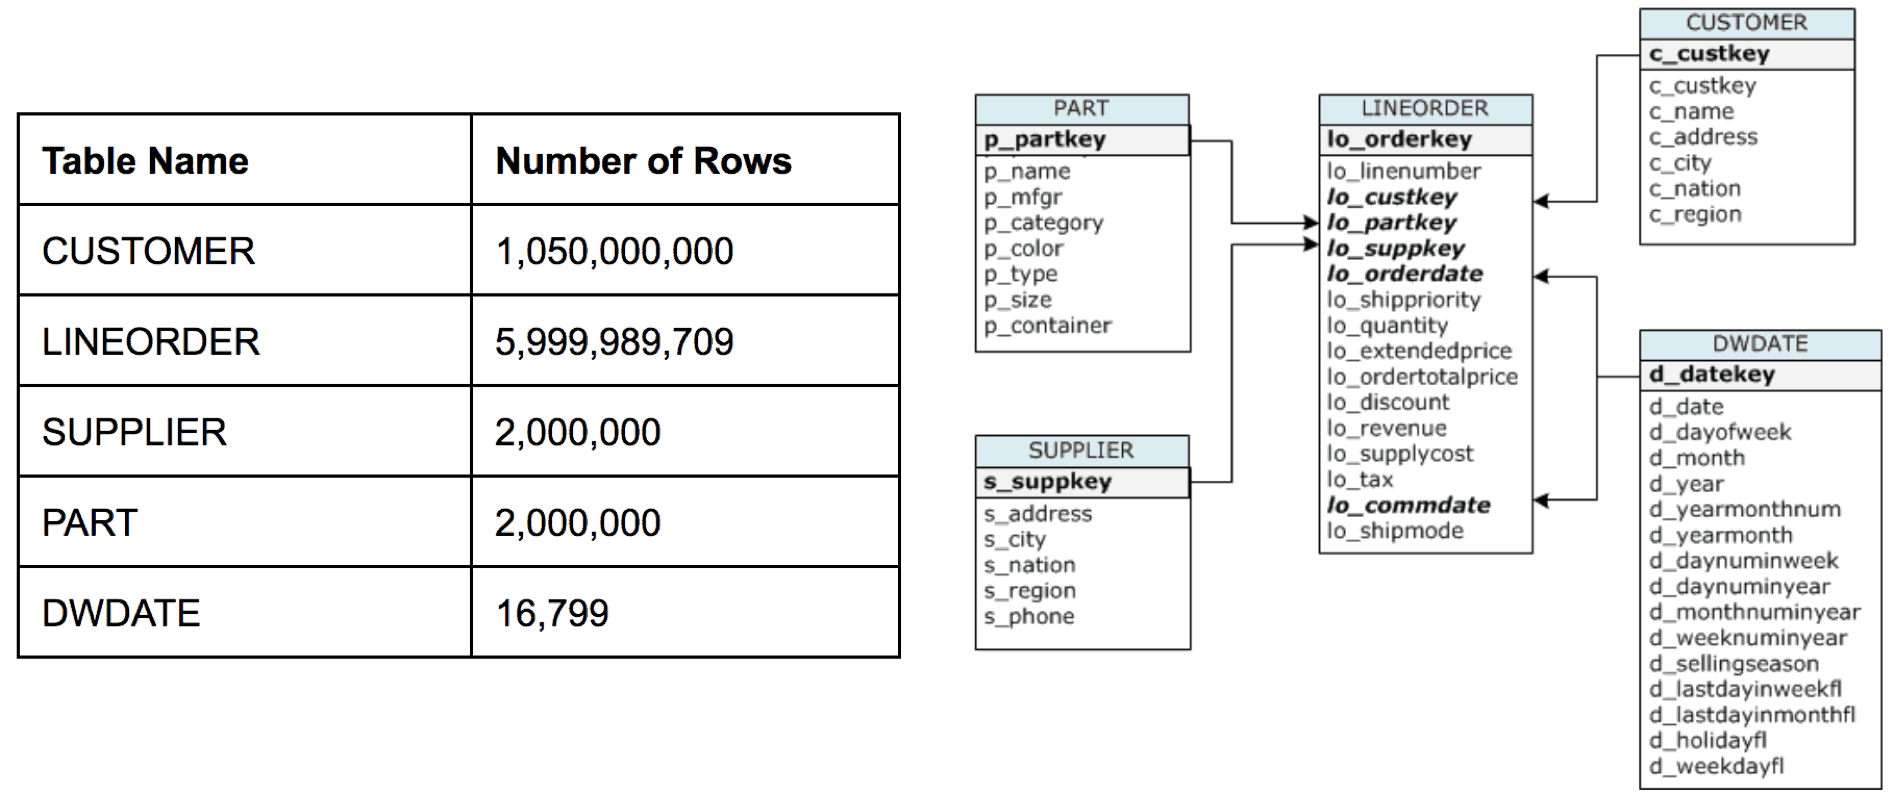
The Benchmark Queries
In order to truly simulate a Business Intelligence enterprise environment, 13 queries were tested. The queries used for this benchmark can be summarized into a several higher level query patterns:
- Q1.1 – Q1.3 are “Quick Metric” queries, which compute a particular metric value for a period of time. These queries have a small number of JOIN operations and minimal or no GROUP BY operations.
- Q2.1 – Q2.3 are “Product Insight” queries, which compute a metric (or several metrics) aggregated against a set of product and date dimension attributes. These queries include medium-sized JOIN operations and a small number of GROUP BY operations.
- Q3.1 – Q4.3 are “Customer Insight” queries, which compute a metric (or several metrics) aggregated against a set of product, customer, and date based dimensions. These queries include both medium and large sized JOIN operations as well as many GROUP BY operations.
Details of the above described queries are shown below in Figure 2.
Figure 2: Benchmark Queries 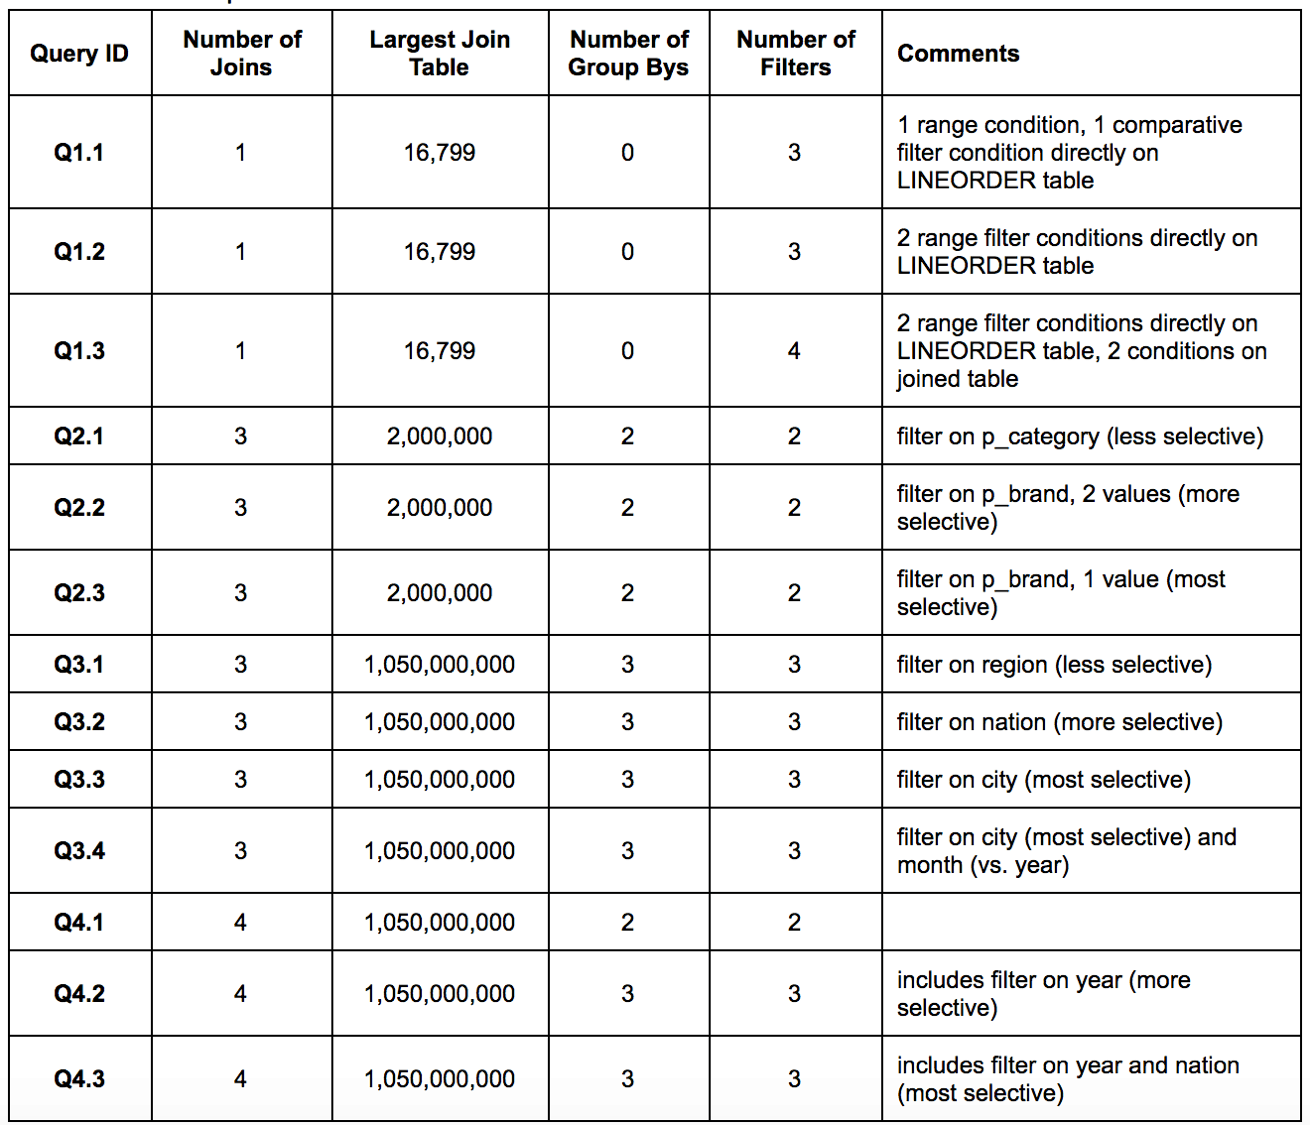
During benchmark testing all 13 queries were executed against the large data set and then subsequently against the tables comprising AtScale’s Adaptive Cache™ (aggregated data generated by the AtScale Engine based on the set of 13 queries issued).
The BigQuery Benchmark
To complete the BigQuery benchmark we first copied our benchmark data set from our in-house 10 node cluster to cloud storage, and from there we loaded the data sets into BigQuery using Google’s simple data loading APIs. The entire process was quite simple and the tools provided by BigQuery were easy to use. Once the data was loaded, we executed our 13 benchmark queries – once on the raw data, once on the aggregated data (comprising AtScale’s adaptive cached), and once with an increasing number of concurrent users (from 1 to 25). The following charts show how BigQuery stacked up against the other BI-on-Hadoop engines in our initial set of comparisons.
Large Query Performance
For “Large Query Performance”, shown below, GCP was comparable to the other SQL-on-Hadoop engines that we tested in previous benchmarks. In some cases (for example queries Q2.x and Q3.x) BigQuery was outperformed by all other engines. In other cases (for example queries Q4.x) BigQuery performed slightly better than Hive and Presto but not as well as SparkSQL. Additionally, Impala and SparkSQL showed much more improvement for selective queries (more restrictive WHERE clauses) as a result of runtime filtering.
Figure 3: Large Query Performance 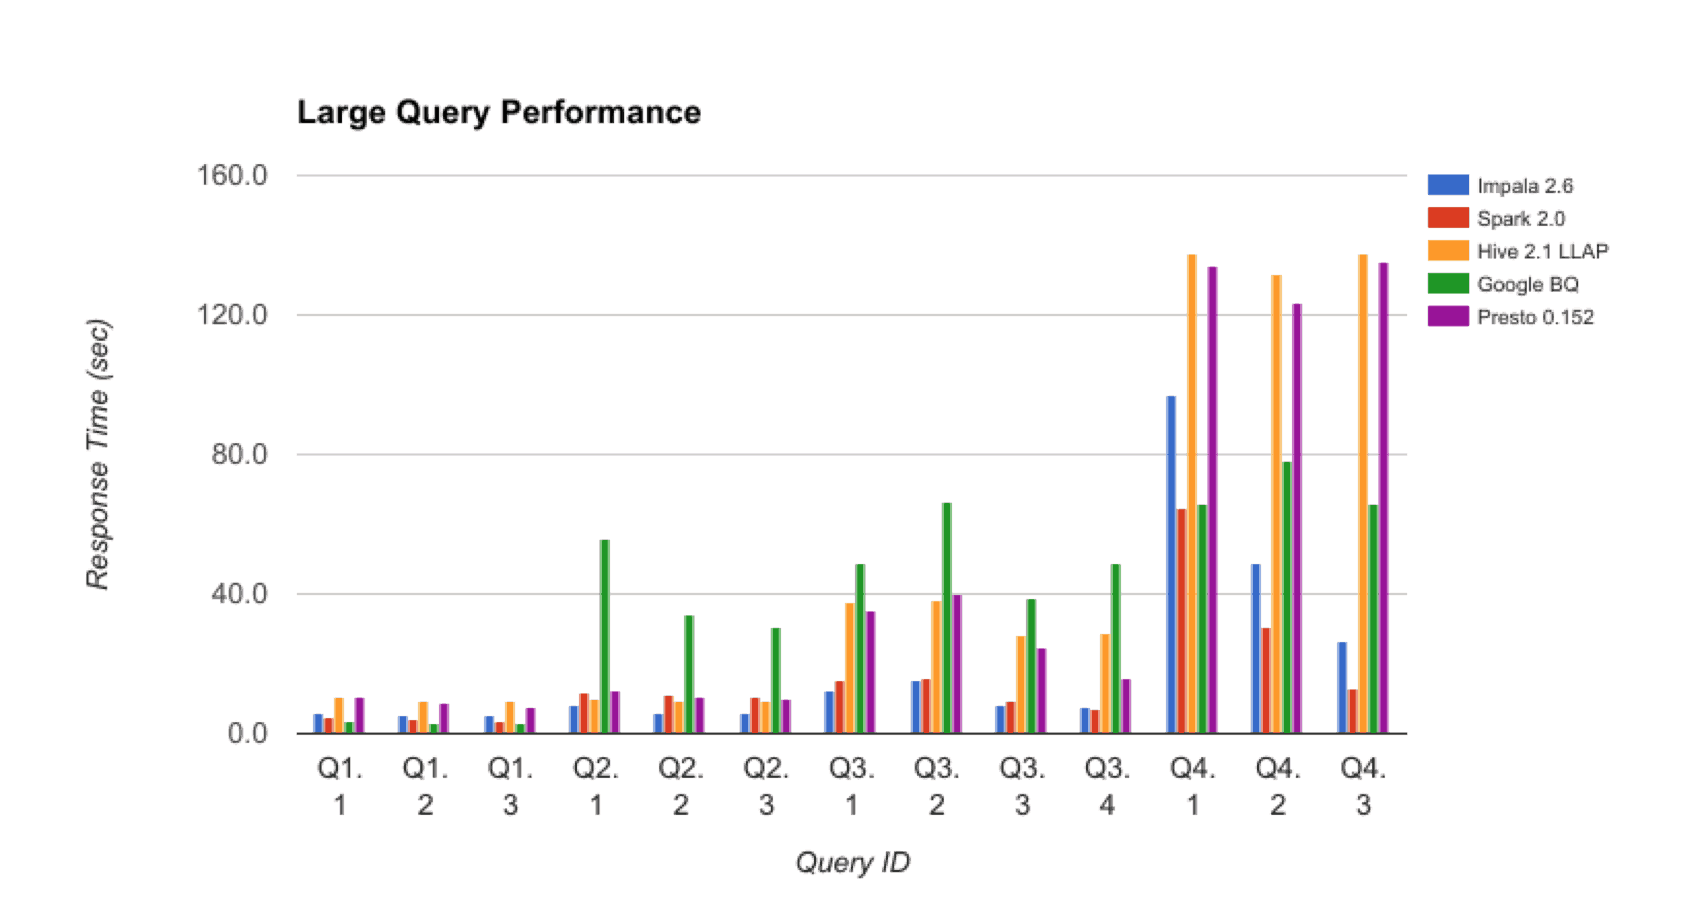
It’s worth noting that the results in the above chart were achieved with no additional query tuning.
Small Query Performance
For “Small Query Performance” BigQuery also tracked fairly closely with the other SQL-on-Hadoop engines, although it was slightly slower on queries Q2.x.
Figure 4: Small Query Performance 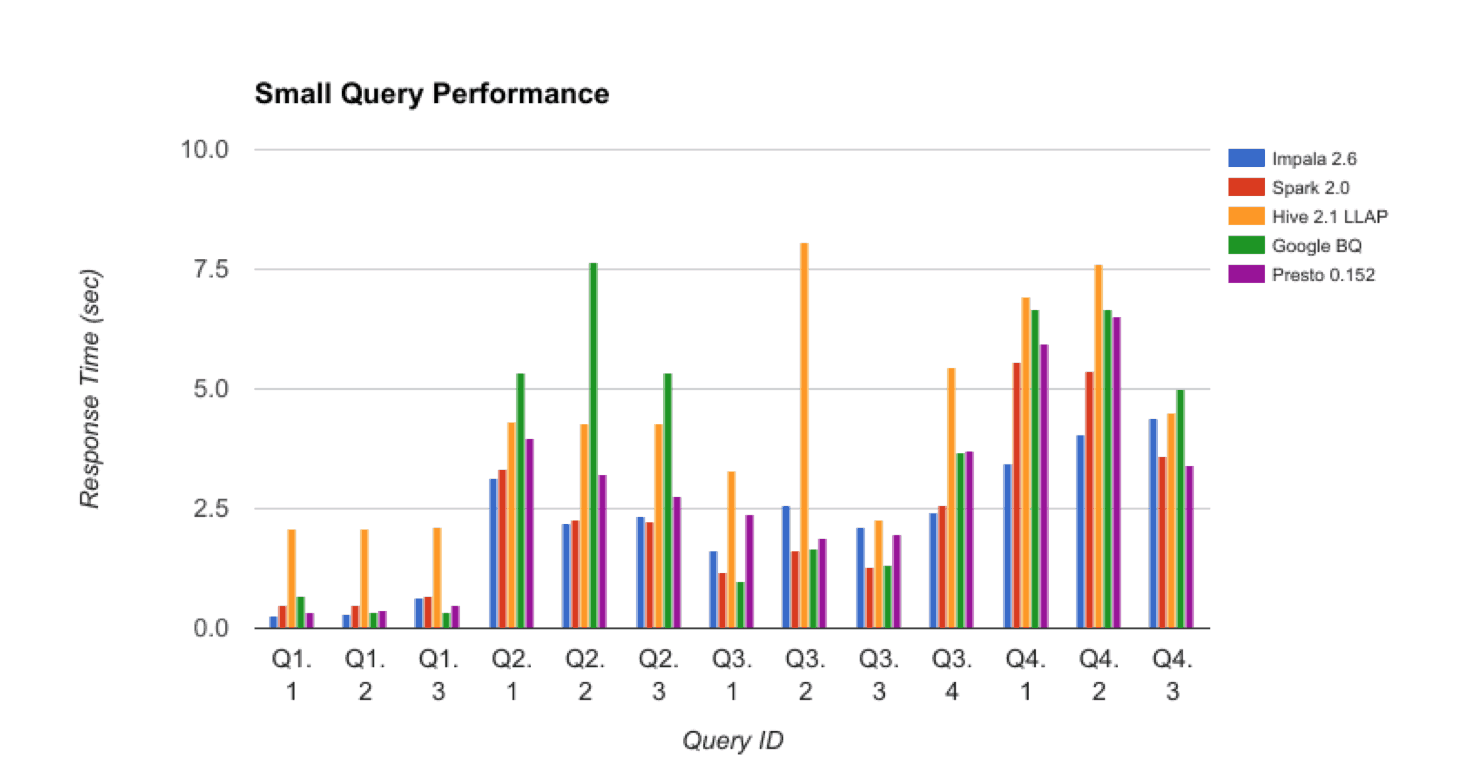
Concurrent Query Volume Performance
An area that GCP excelled in was supporting concurrent query volume. Unlike our other SQL-on-Hadoop benchmarks, where the total available resources for queries was throughput-constrained by the size of the cluster, It’s “serverless” model means that concurrent query response time profiles remained effectively flat, even as we went past the 25 concurrent user mark.
__Figure 5: Concurrent Query Performace __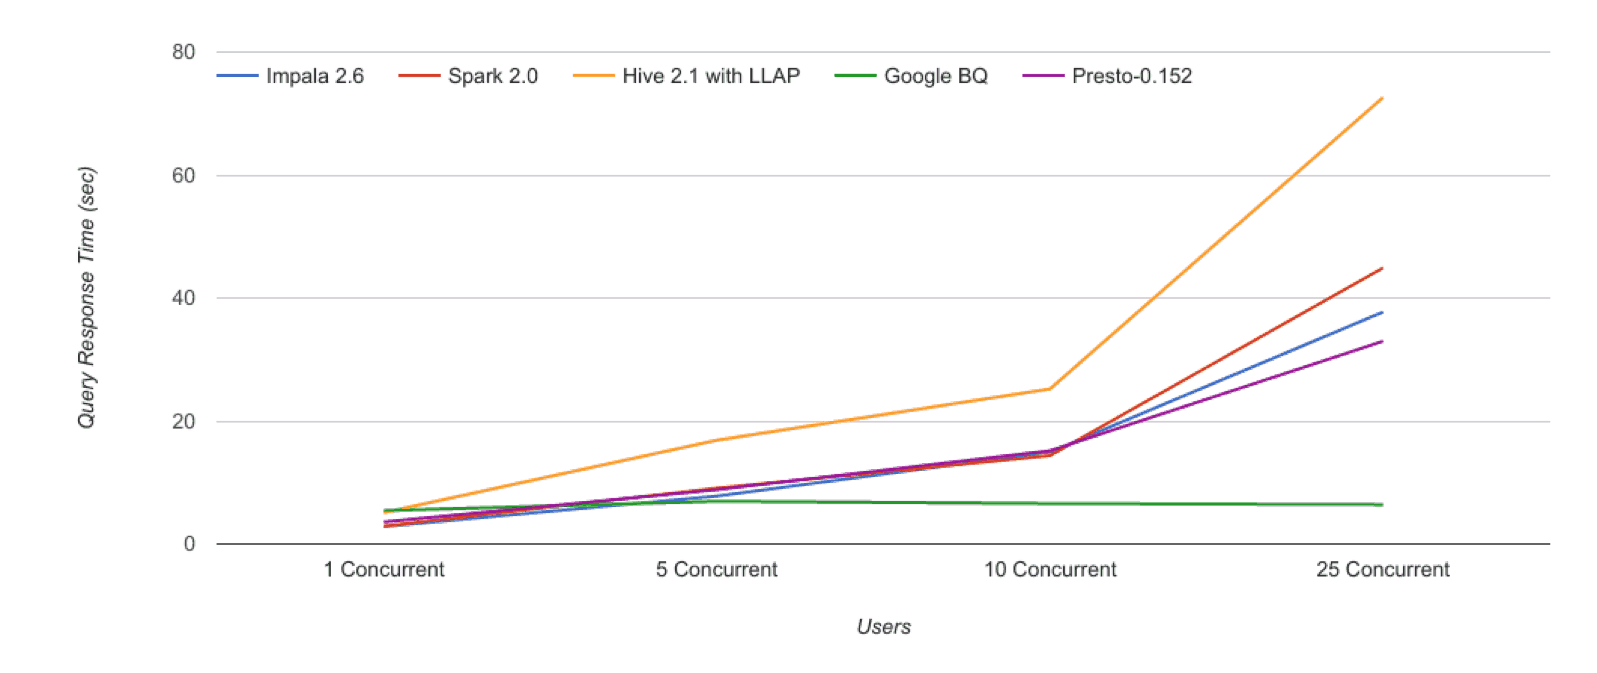
Conclusion
Overall, we were very impressed with the results of our initial benchmarking of Google BigQuery.
- 1 – Data Easy to Load: Data was relatively easy to load using the tools providing.
- 2 – Large Data Set Performance : It’s performance on our large data set was in line with our experience with SQL-on-Hadoop engines, and BigQuery performed acceptably on the aggregated data sets as well.
- 3 – Concurrent Performance Impressive : We were most impressed with it’s performance under concurrent workloads, and think this is an important consideration to take into account as enterprises continue their evaluation of options for Big Data query engines.
As we announced recently, BigQuery is one of the engines that is included in AtScale’s planned support for an expanded number of Big Data platforms. We’re are excited to join our customers as they investigate this new option!
Thanks for listening. Until next time…
~Josh
SHARE
Case Study: Vodafone Portugal Modernizes Data Analytics