This blog was written by Dr. Prashanth Southekal, the Managing Principal of DBP Institute (www.dbp institute.com), a data and analytics consulting, research, and education firm. He is a Consultant, Author, and Professor. Author’s Note: This is an update to the blog post “Actionable Insights for Improved Business Results,” originally published in February 2022.
The data economy is increasingly embraced globally and in every industry. The World Economic Forum (WEF) estimates that 463 exabytes of data will be created each day worldwide by 2025. This is the equivalent of 200 million DVDs of data created per day [WEF, 2019]. Organizations worldwide face overwhelming amounts of data and seek ways to derive business insights from data analytics.
Why do data insights matter for business? They help companies gain better visibility, make faster decisions, and improve business results. McKinsey’s research found that insight-driven companies report above-market growth and EBITDA (earnings before interest, taxes, depreciation, and amortization) [Mckinsey1, 2022].
But what is an insight? In the data analytics world, an insight is a specific element influencing a business decision. A few examples include a relationship, pattern, categorization, inferences, prediction, averages, correlations, variations, quartiles, outliers, confidence levels, or intervals.
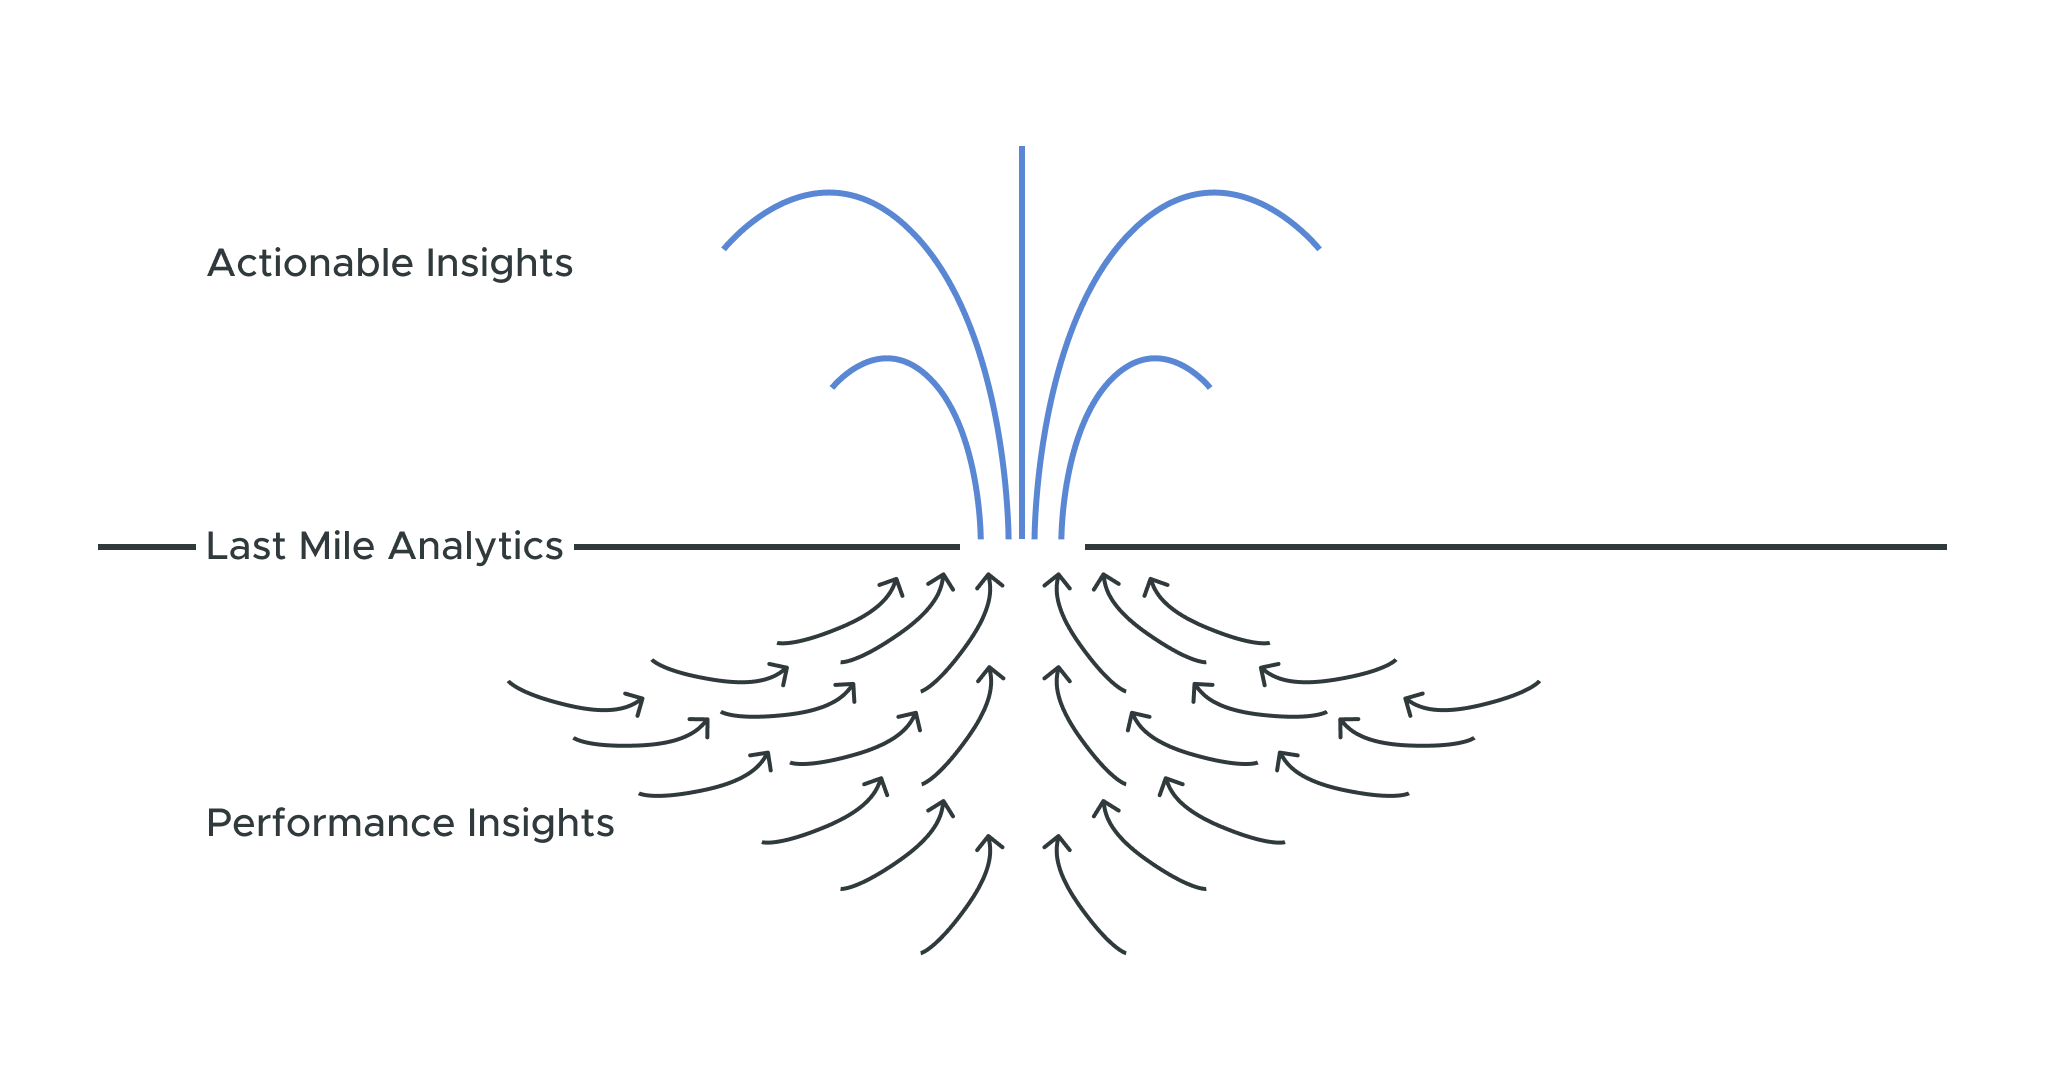
Insights are classified as hindsight (understanding a past situation), near-sight (interpreting the current situation), and foresight (predicting a future situation) [Southekal, 2020]. We can also use the data and analytics value realization perspective to break them down into two categories:
- Performance Insights. Performance insights provide visibility on the measurement entity. For example, we can examine a company’s top five products by sales quantity, top three customers by MRR (monthly recurring revenue), and so on. Effective data storytelling techniques are the key to managing the two options that performance insights offer: (a) to know or (b) to act.
- Actionable Insights. Businesses use performance insights to derive actionable insights. These action-oriented insights include three elements: (a) Data-driven decision (b) Commitment to invest resources like time, money, labor, etc. to follow through with the decision (c) Business impact and consequences of the decision.
Examples of actionable insights include: product A is the best option to invest in, customer X should be given a credit, etc.
3 Steps for Gaining Actionable Data Insights
So, how can enterprises maximize the value of these insights? In data and analytics, “last mile analytics” is often the missing piece between data analytics output and actual business results. In fact, 90% of organizations that significantly outperform their peers are devoting more than half of their analytics budgets to bridging the last mile of analytics [Mckinsey2, 2018].
In other words, business enterprises must focus on converting performance insights into actionable insights. Here are three key steps that companies can take to implement these vital actionable insights:
1. Derive performance insights
Performance insights are derived from a combination of business objectives, questions, KPIs, and data. Businesses should lean into descriptive, predictive, and prescriptive analytics techniques/models that provide visibility into past, current, and future states.
The data related to each question and KPI should be sourced from the right data source — typically the transactional SoR (System of Record). Many organizations derive faster insights in this stage by leveraging the semantic layer for standardized data definitions and rapid data access [Southekal, 2022].
To ensure that these performance insights are reliable, it’s important to factor in different stakeholder perspectives, time frames, and locations. Businesses must also avoid framing bias by reframing the problem in at least three different ways. They should also map the data source subjects and understand the data attributes (i.e., features), aligning data source content to the question/answer they seek.
Figure 1 illustrates the relationships between business objectives, questions, KPIs (Key Performance Indicators), semantic data, and models to derive insights:
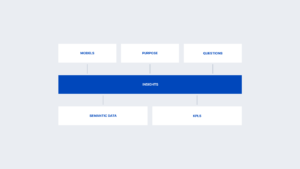
Figure 1: Insight Value Chain
2. Formulate the decision problem.
A typical decision problem has four key elements: objectives, alternatives, outcomes, and payoff.
- The objectives, which are based on performance insights, define what the business plans to achieve from the decision.
- The alternatives are the potential actions or strategies they are considering. These potential options are based on different performance criteria such as profit margin, cost, time, quality, service, and more. It’s recommended to keep the number of alternatives to three. The Pugh Matrix or Decision Matrix can be used to narrow down the available alternatives.
- The outcomes, which are usually probabilistic, are the resulting situations that would arise by pursuing the selected alternatives.
- The payoffs or benefits are the values placed on the outcomes associated with each alternative. The payoff values are a combination of tangible and intangible benefits.
Using the appropriate decision science techniques, these four elements help the business decide on the best alternative.
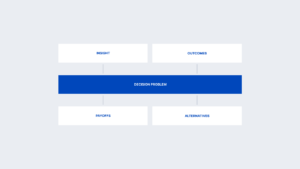
Figure 2: Elements of a Decision Problem
3. Identify the resources needed to execute the decision.
The resources could include time, skills, budget, equipment, and data. To execute the decision, be sure to manage change with the right ownership or accountability. This means relying on an accountable leader who is close to the objective and business performance KPIs.
For example, if the KPI for improving the cash conversion cycle (CCC) is “Days Payable Outstanding (DPO),” the Account Payable (AP) Manager should track and improve the DPO KPI. Identifying the most competent leader will help to mobilize the necessary support (the desired resources and culture) and convert the insights and decisions into action.
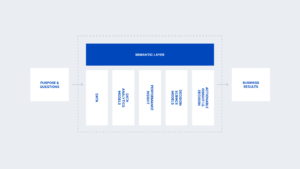
Figure 3: Insight Process Flow
The effectiveness of a decision can be validated with appropriate feedback mechanisms. Remember that drifts in models and data will happen as the business evolves and adapts to change. The best way to manage the model and data drift is to continuously measure the performance of data and models with the right KPIs and feedback mechanisms [Southekal, 2021]. See the insight value chain/process flow and its components in figure 3.
The Business Impact of Actionable Insights
Today, actionable data insights are at the heart of every business decision to help companies increase revenue, reduce expenses, and manage risk. The purpose of insights is not just to know. It is also to know and act, enabling informed decision-making and improved business performance.
These three steps for implementing actionable data insights can help organizations formulate the right business and data strategy. They empower companies to turn data into performance insights, then into actionable insights for driving action and achieving business goals.
Learn more about AtScale’s approach to facilitating actionable data insights for everyone with a universal semantic layer.
Sources
- Mckinsey1, “Insights to impact: Creating and sustaining data-driven commercial growth”, https://www.mckinsey.com/business-functions/marketing-and-sales/our-insights/insights-to-impact-creating-and-sustaining-data-driven-commercial-growth, January, 2022
- Mckinsey2, “Breaking away: The secrets to scaling analytics”, https://www.mckinsey.com/business-functions/mckinsey-analytics/our-insights/breaking-away-the-secrets-to-scaling-analytics, May, 2018
- Southekal, Prashanth, “Analytics Best Practices”, Technics Publications, April 2020
- Southekal, Prashanth, “Model Drift in Data Analytics: What Is It? So What? Now What?”, Forbes, Sept 2021
- Southekal, Prashanth, “Demystifying the Semantic Layer for Smarter, Faster AI and BI”, Demystifying the Semantic Layer – White Paper AtScale, Mar 2022
- WEF, “How much data is generated each day? “, https://www.weforum.org/agenda/2019/04/how-much-data-is-generated-each-day-cf4bddf29f/, Apr, 2019
Dr. Prashanth Southekal has worked and consulted for over 80 organizations including P&G, GE, Shell, Apple, and SAP. He is the inventor of DEAR Model, a systematic and structured approach for data-driven decision-making. Dr. Southekal is the author of two books – “Data for Business Performance” and “Analytics Best Practices” – and writes regularly on data, analytics, and machine learning in Forbes, FP&A Trends, and CFO.University. Apart from his consulting pursuits, he has trained over 3,000 professionals worldwide in Data and Analytics. Dr. Southekal is also an Adjunct Professor of Data and Analytics at IE Business School (Madrid, Spain) and CDO Magazine included him in the top 75 global academic data leaders of 2022. He holds a Ph.D. from ESC Lille (FR) and an MBA from Kellogg School of Management (U.S.). He lives in Calgary, Canada with his wife, two children, and a high-energy Goldendoodle dog. Outside work, he loves juggling and cricket.
SHARE
NEW BOOK