As organizations become more data-centric, companies are bringing in data from more sources and storing more volume. That’s only added more fuel to the ongoing data cloud ‘platform wars’, particularly with Databricks and Snowflake.
With some exciting benchmark results recently published by Databricks, we decided to do a blog post exploring how to combine Databricks with AtScale to replace Service Analysis Services (SSAS) in the cloud.
Why AtScale + Databricks vs. SSAS
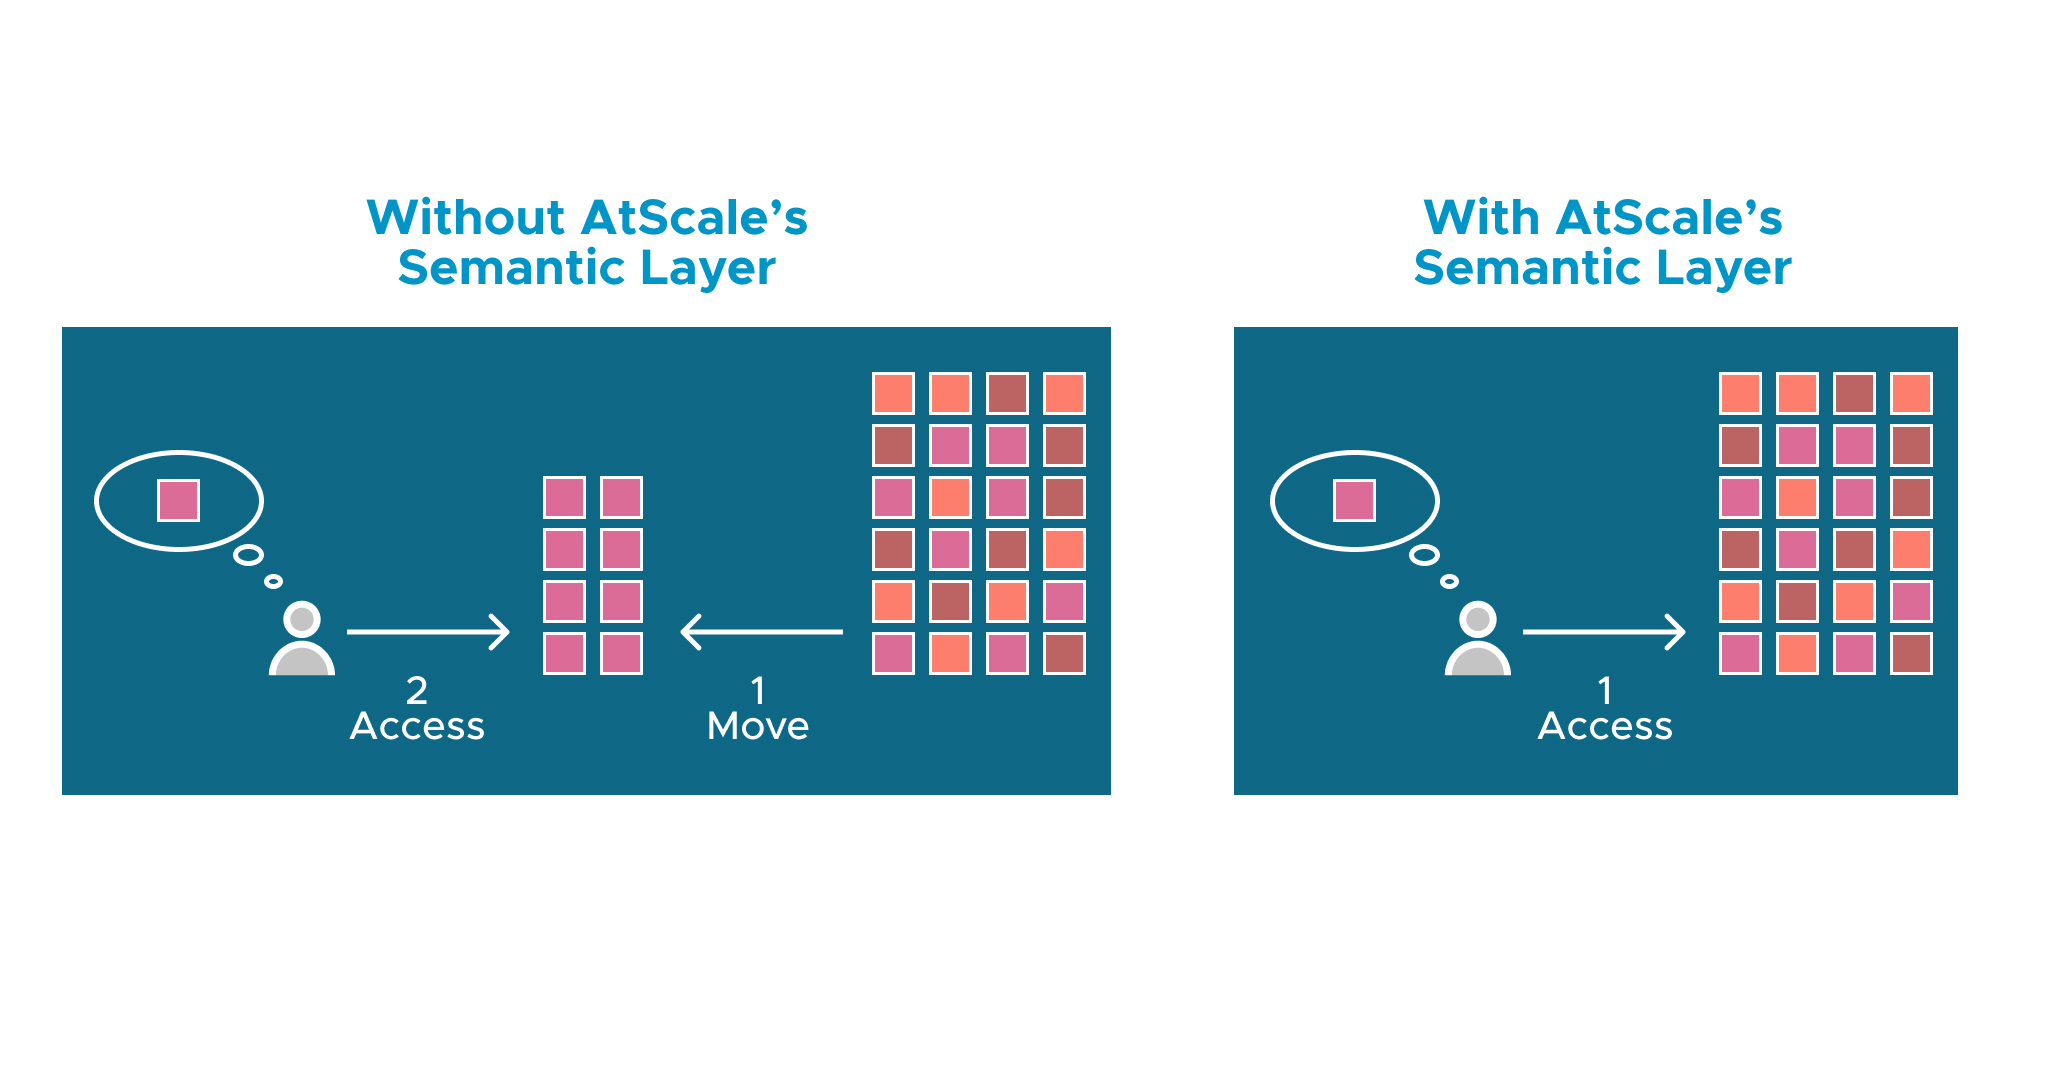
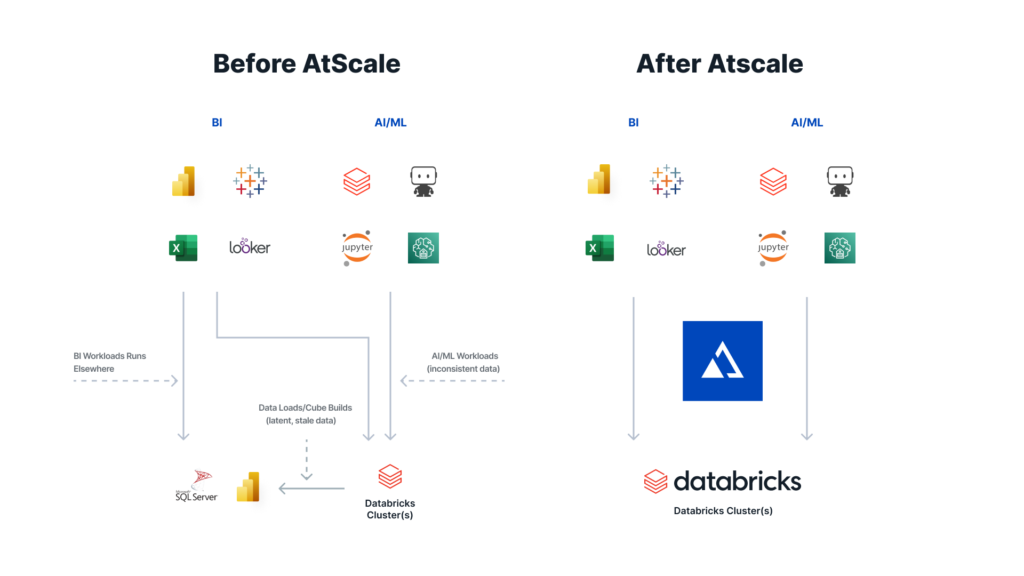
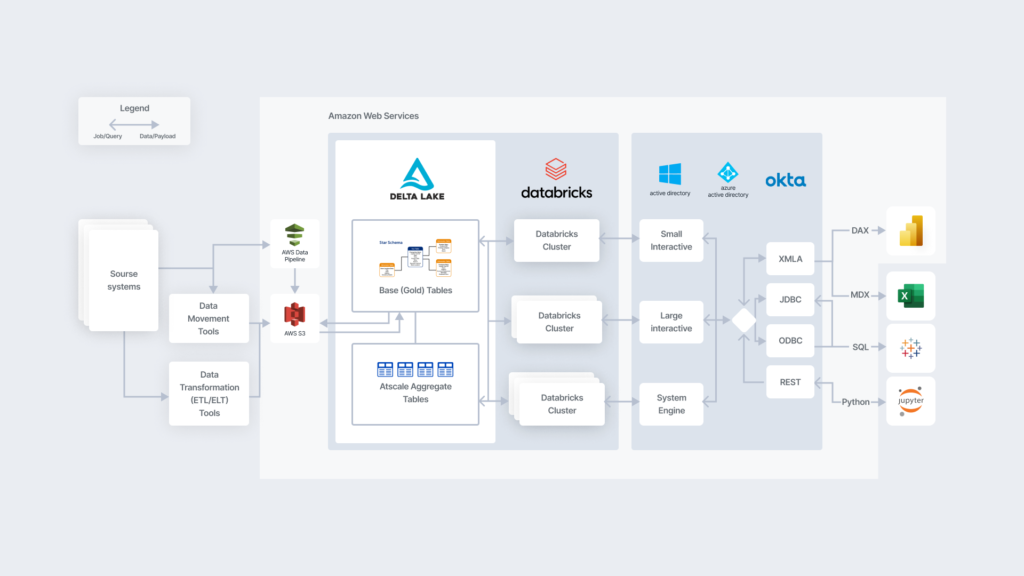
One of the most significant limitations of SSAS is the need to move or create a separate copy of the source data. With AtScale and Databricks together, the data can stay in the Databricks cluster with all queries running directly against that cluster, eliminating the need for data movement. This implementation style supports a variety of tools, including the Microsoft stack, Tableau, Looker, and data science tools via a Python interface.
A huge benefit to this is scalability. Rather than requiring teams to provision and scale a different environment for hosting data cubes like in SSAS implementations, AtScale with Databricks scales automatically with the platform. Users can access hundreds of billions or even trillions of rows without the risk of running out of resources.
With company systems handling so many different data sources and interfaces, BI solutions need flexibility and support for various data sources and models. AtScale + Databricks can handle data in other data stores and locations via data virtualization and also supports multidimensional models, eliminating the need to port data cubes into tabular models.
Replace your Serving Layer with direct, live access
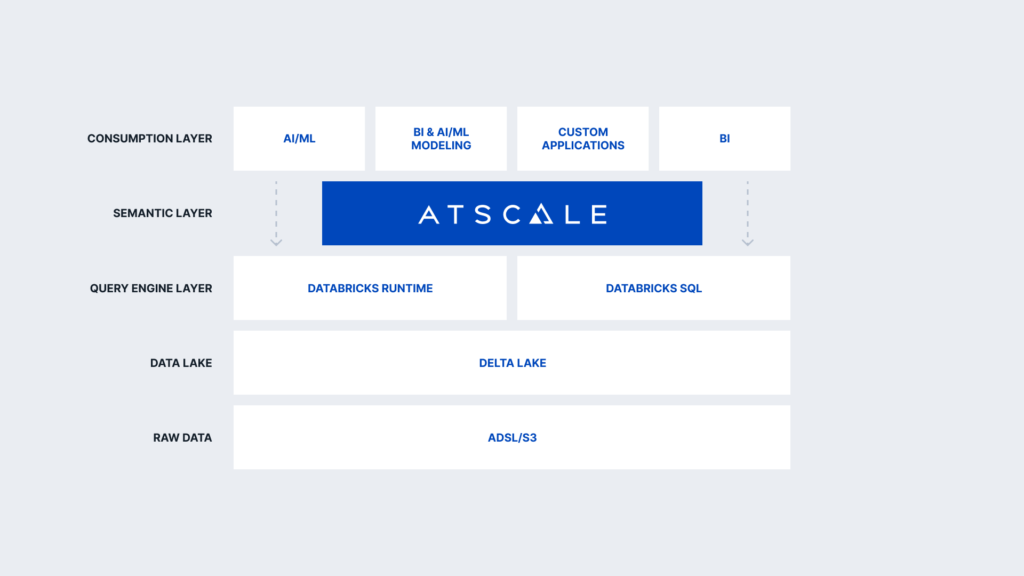
AtScale helps Databricks customers remove the complexities of managing a separate optional serving layer, replacing it with direct, live access to AtScale. With an effortless drag and drop interface, the operators can use the AtScale design center to access the tables in their Databricks cluster. They can blend disparate data sets, define KPIs, and build more complex metrics like time relative measures for time series analysis.
One of the most powerful features is combining dimensions from different models to create additional reusable models. Many platforms claim to be multidimensional but are multidimensional in name only. With AtScale, time intelligence is built natively into the tool, greatly simplifying the lift in applying BI’s time-based measures and metrics. AtScale users can also establish key-value pairs to correlate and map columns from their Databricks data. These simple activities build out a semantic layer, which is publishable with a single click.
Using Excel is simple as well. Using the built-in analysis servers driver with Excel and Power BI, users can run live queries against the semantic layer and build any formulas and calculations leveraging existing Excel functionality. Once the semantic layer is in place, users can log in to BI tools like Tableau, connect to AtScale, and run live queries against their Databricks cluster. Power BI users don’t need to worry about connecting directly to the Databricks cluster because the live queries are happening against the semantic layer.
AtScale + Databricks redefines the meaning of “live” connections and queries, with processing durations clocking at milliseconds. That’s because AtScale eliminates the need for complex query optimization and data aggregation, performing those tasks automatically under the hood.
Data Lakehouse Webinar with Soham Bhatt
We recently held a webinar on how to use Data Lakehouse for AI and BI where we got to catch up with Soham Bhatt, the EDW Modernization Practice Lead at Databricks. He shared some fascinating insights about Lakehouse architecture and why BI and AI are starting to converge on the platform.
One of the biggest takeaways was how integrated, and integral, data science has become in organizations. In high-performing organizations, engineers, scientists, AI experts, and the business as a whole are working together to make BI happen. Unfortunately, only 1-5% of enterprises successfully use AI/ML to bring value to their business.
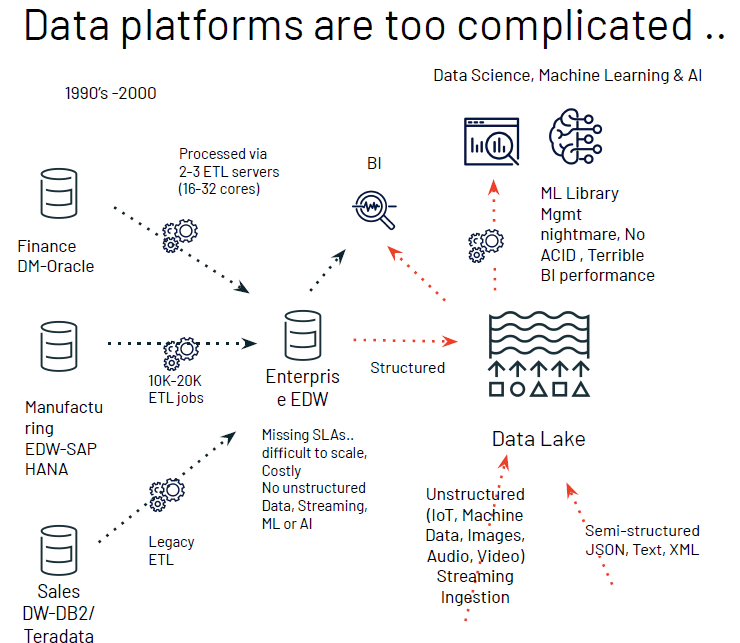
Companies struggle when data platforms are too complicated. With warehouse models, data is fragmented across many systems; when each system has its own support footprint, silos can get in the way of data team collaboration. The advent of Data Lakes helped bridge the gap. However, they still struggle with BI performance because it is difficult to handle the inconsistent, unstructured data prevalent in these platforms.
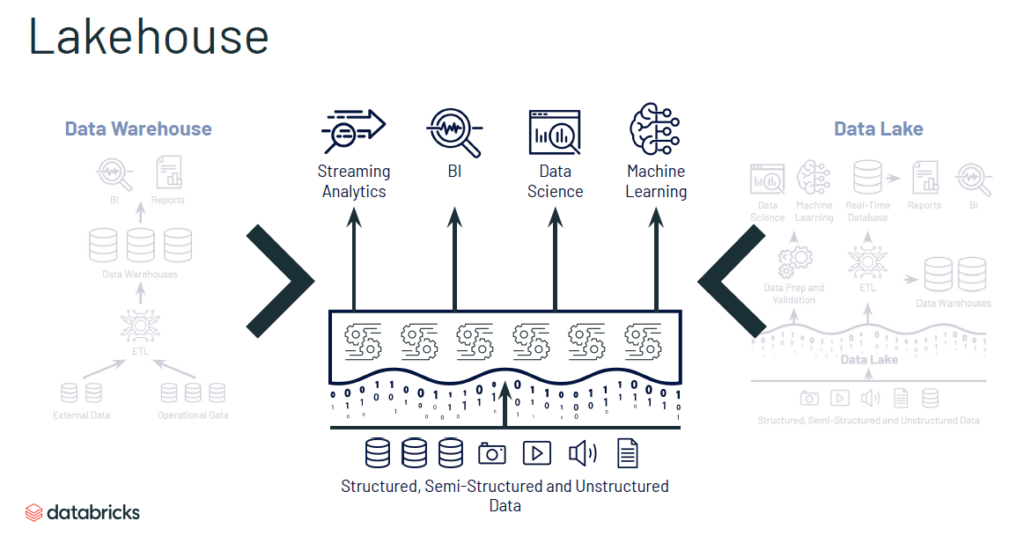
The Databricks Lakehouse platform aims to deliver the best from data warehouses and data lakes without the inherent shortcomings. The differentiator is the ability to handle structured, semi-structured, and unstructured data, separate from the computing infrastructure, which can apply BI and ML capabilities on-demand even with open data formats.
Modernize SSAS-style Analytics on Databricks with AtScale
Combining AtScale with Databricks Lakehouse helps companies eliminate the need for siloed data warehouses and costly data movements within the cloud, delivering unified, live queries that work with any BI platform. Replacing your legacy Cube architectures like SSAS will enable dimensional analysis in milliseconds. Check out our tech talk or schedule a customized demo to learn more about how Databricks Lakehouse and AtScale’s Semantic Layer can deliver faster self-service analysis to your organization.
SHARE
Case Study: Vodafone Portugal Modernizes Data Analytics