
The more things change, the more they stay the same. There is tremendous push towards new platforms capable of dealing with massive amounts of data. Data is flowing at a scale once considered impossible, and the sources of data are more diverse than ever. It’s coming from ERP systems, General Ledgers, weather feeds, Supply Chain, IOT, and many other sources. And while AI and ML are discovering brand new ways to analyze data, there are critical business analytics that need to continue to process.
What’s so ironic? As we get better and better at new analytics, these new platforms are making it hard to run proven complex business intelligence analytics.
THE PROBLEM
Clients in the banking and financial services industries often ask me business questions that require complex date and time-shift calculations. For example, at one of my recent projects at a bank, my client was looking to report on Parallel Period and Period-to-Date growth in the bank’s customer account ending balances.
To provide a bit more background, the bank needed to determine the performance of their loan and credit customer accounts, specifically how these accounts are doing now compared to before. Each account has an ending balance captured in a table on each day. It was crucial for the bank to find out the following in both nominal and percentage numbers:
- Day-over-Day growth
- Year-over-Year growth
- Month-to-Date growth
- Year-to-Date growth
There are many different ways to do these calculations. The client had a legacy data warehouse system, and the business analysts were downloading Microsoft Excel sheets everyday and pasting data in a specific format that fits into a pivot table. Like most companies today, they are moving to a data lake architecture and making efforts to streamline business intelligence reporting.
In today’s blog, I will go over how AtScale can help with these complex models with a combination of row-level calculations, aggregate calculated measures, time-shifting methods, and more.
The new data platforms have been so laser focused on scale and compute strength, that the business analyst has been largely forgotten. AtScale leverages the strength of these new platforms, provides the data modeler a great UI for complex business calculation, and produces a data service loved by the business.
HOW WE SOLVE IT
In this use case, we are looking at a table which contains all customer accounts and their individual balances of the day. Such tables typically have a date column in the format of “yyyy-MM-dd” or a timestamp column in the format of “yyyy-MM-dd HH:mm:ss.SSSSSS”.
BUILDING THE TIME-REFERENCE POINTS
The first step towards calculating the complex time-specific information required by banks is to open the AtScale Design Center — a browser-based UI that allows data architects to develop virtual multidimensional models.
In order to properly calculate these time aware measures, we would need to create various reference points in time at the row level. You can do this easily in the AtScale Design Center by leveraging the Calculate Column feature. This creates a logical definition on top of your dataset, which can be used in downstream calculations and in any reporting tool that supports SQL, MDX, and REST. These are the formulas I used to create these time reference points:
1.) Today TS (November 6th, 2018)
— NOW()
2.) Yesterday TS (November 5th, 2018)
— DATE_SUB(NOW(), 1)
3.) End of Last Month TS (October 31st, 2018)
— DATE_SUB(NOW() ,day(now()))
4.) One Month Ago TS (October 6th, 2018)
— DATE_SUB(NOW(), INTERVAL 1 MONTH)
— Note that you can also use YEAR[S], MONTH[S], WEEK[S], DAY[S], HOUR[S], MINUTE[S], SECOND[S], MILLISECOND[S], MICROSECOND[S], and NANOSECOND[S]
5.) Last Day of Last Year TS (December 31st, 2017)
— DATE_SUB(DATE_SUB(DATE_ADD(NOW() ,INTERVAL 1 MONTH),INTERVAL MONTH(NOW()) MONTH), DAY(NOW()))
— We can break it down for easier understanding. First we needed Today of Next Month (December 4th, 2018):
DATE_ADD(NOW() ,INTERVAL 1 MONTH)
— Then subtract current number of months (Jan 4th, 2018)
DATE_SUB(DATE_ADD(NOW() ,INTERVAL 1 MONTH),INTERVAL MONTH(NOW()) MONTH)
— Then subtract number of days in the month(Dec 31, 2017)
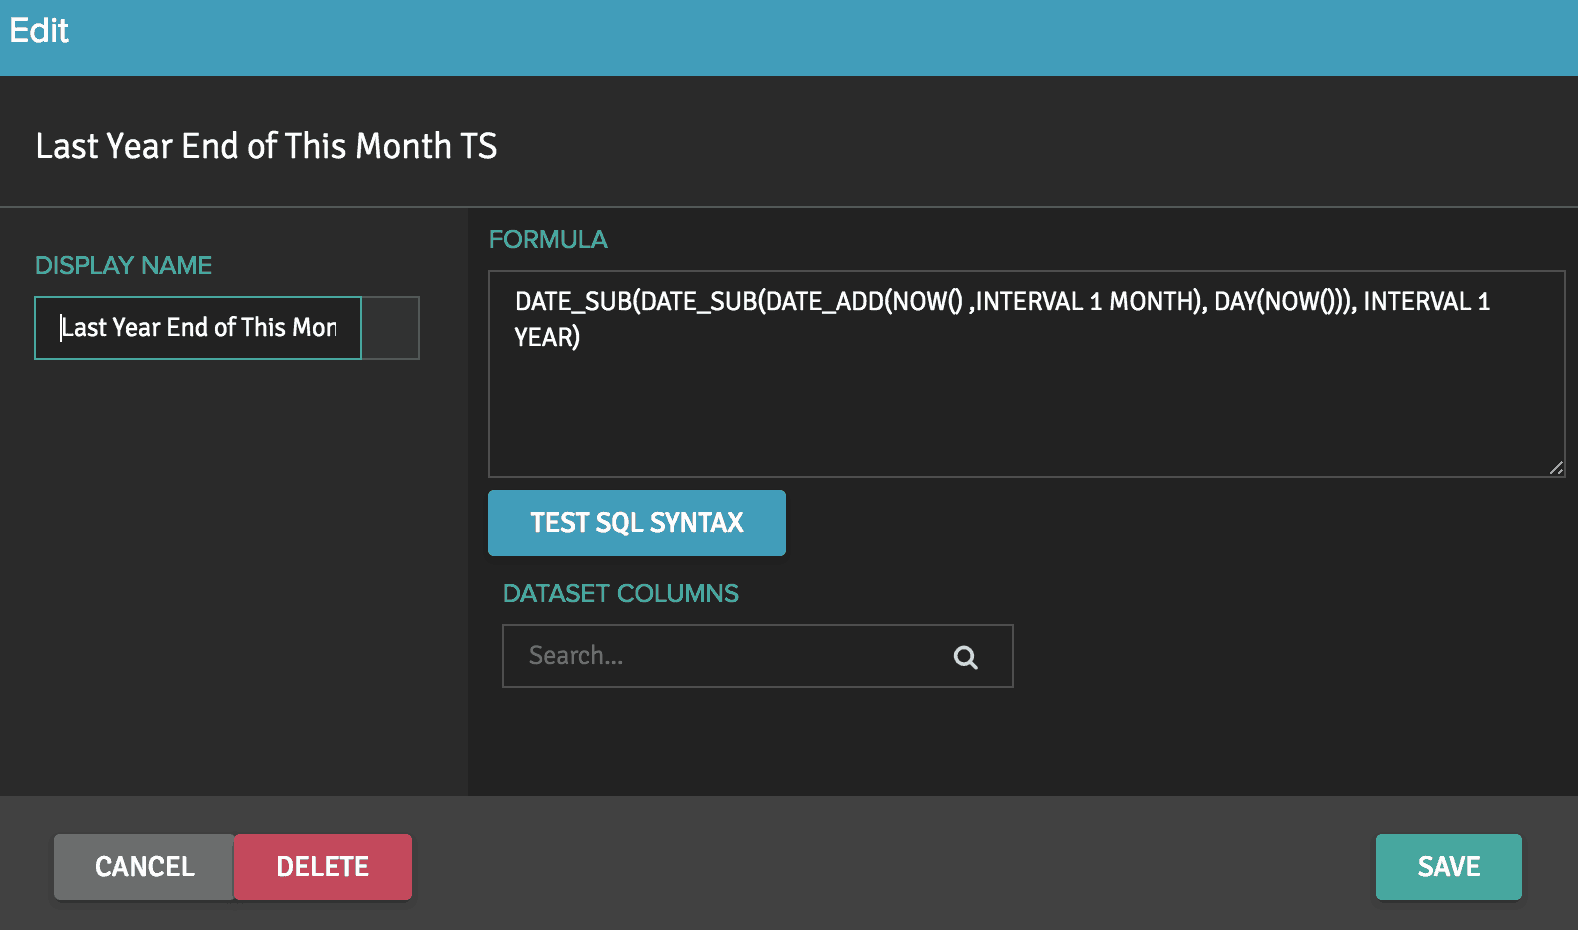
6.) Last Year End of This Month TS (November 30th, 2017)
— DATE_SUB(DATE_SUB(DATE_ADD(NOW() ,INTERVAL 1 MONTH), DAY(NOW())), INTERVAL 1 YEAR)
— Let’s break it down: first we need Today of next month (December 6th, 2018)
DATE_ADD(NOW() ,INTERVAL 1 MONTH)
— Then get the end of this month (November 30th, 2018)
DATE_SUB(DATE_ADD(NOW() ,INTERVAL 1 MONTH), DAY(NOW()))
Then subtract 1 year (November 30th, 2017)
CALCULATING THE BALANCE
Once we have the time reference columns created, it becomes very easy to apply them to the customer account balance. Another set of Calculated Columns is created in AtScale to display the account ending balance for particular dates. In this example, I have a business time column called “bus_ts” and a current balance column called “curr_bal_amt” for each customer account on each day.
1.) We are using a simple “IF” function to determine the rows that fit the criteria of “Today”
IF(TO_DATE(bus_ts)=TO_DATE(NOW()),curr_bal_amt,0)
2.) Yesterday Amount
IF(TO_DATE(bus_ts)=TO_DATE(DATE_SUB(NOW() ,1)),curr_bal_amt,0)
3.) End of Last Month Amount
IF(TO_DATE(bus_ts)=TO_DATE(DATE_SUB(NOW() ,DAY(NOW()))),curr_bal_amt,0)
4.) One Month Ago Amount
IF(TO_DATE(bus_ts)=TO_DATE(DATE_SUB(NOW(), INTERVAL 1 MONTH)),curr_bal_amt,0)
5.) Last Day of Last Year Amount
IF(TO_DATE(bus_ts)=TO_DATE(DATE_SUB(DATE_SUB(DATE_ADD(NOW() ,INTERVAL 1 MONTH),INTERVAL MONTH(NOW()) MONTH), DAY(NOW()))),curr_bal_amt,0)
6.) Last Year End of This Month Amount
IF(TO_DATE(bus_ts)=TO_DATE(DATE_SUB(DATE_SUB(DATE_ADD(NOW() ,INTERVAL 1 MONTH), DAY(NOW())), INTERVAL 1 YEAR)),curr_bal_amt,0)
The resulting dataset looks like this:
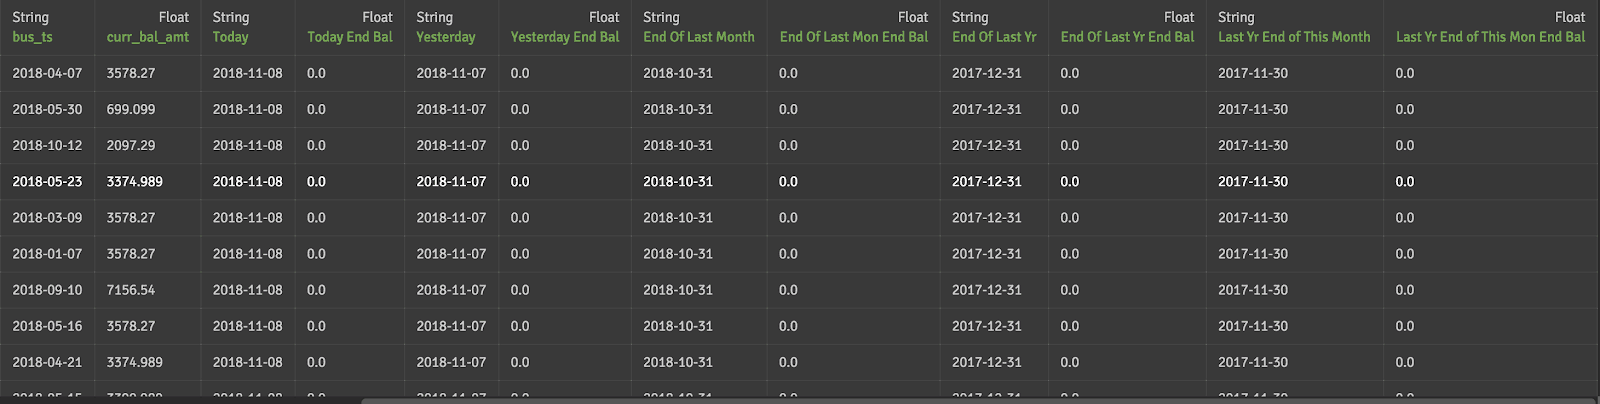


When the “bus_ts” matches the reference time column, the ending balance appears in that row, while the rest remains 0.
With these new columns added to your dataset, you can now accomplish some time relative calculations. To do this, you can use Calculated Measures in AtScale. These are essentially multi-pass queries that take the results from the first pass (Yesterday Amount and Today Amount), and perform calculations such as Growth Amount or Growth Percentage.
With the Ending Balances in the previous section, you can now calculate:
- Day over Day growth
- Month to Date growth
- Year to Date growth
- Year over Year growth
Using the following process:
1. Drag all the new Calculated Columns of the Amount columns from the previous section into the Measures panel on the right side. For example, drag the “Today Amount” in, and name the measure “Today Ending Balance”. Choose “Sum” as the aggregation. This gives us the total ending balance for today for all customer accounts.
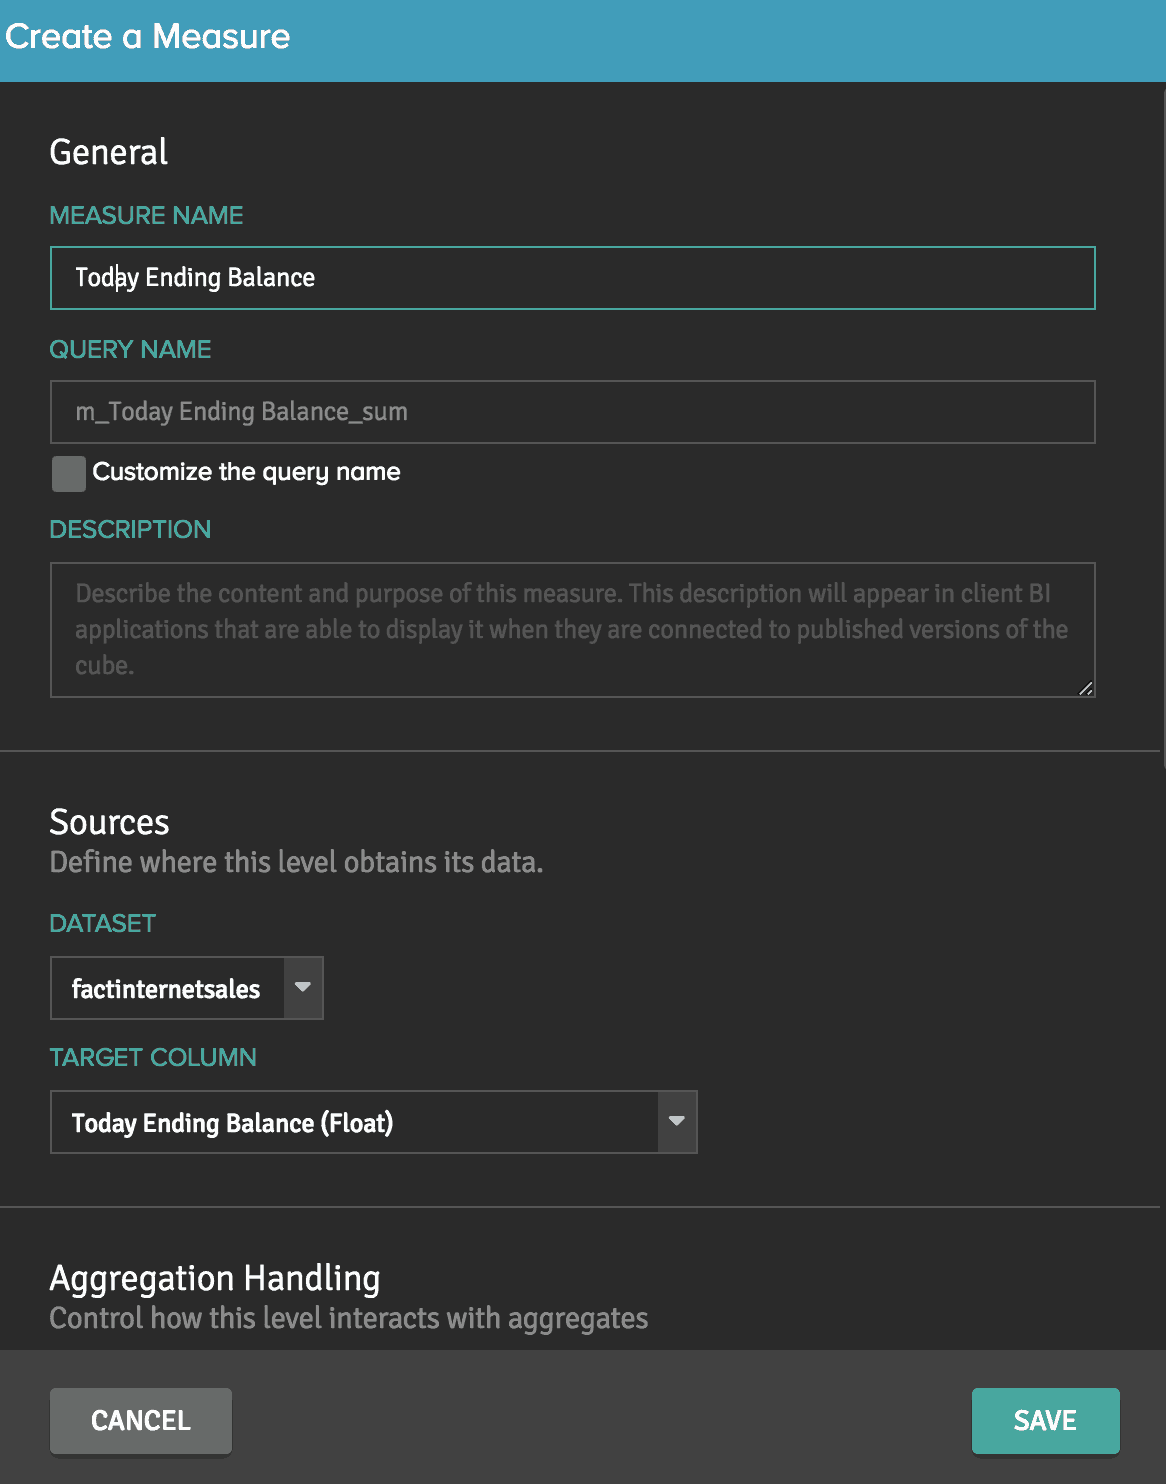
2. Hit Save
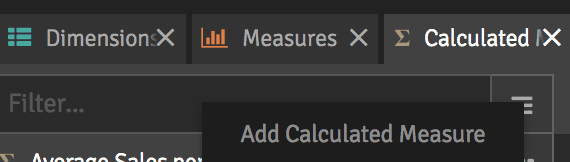
3. Select the “Calculated Measures” tab on the right panel
4. Click on the Menu icon (3 horizontal lines) and select Add Calculated Measure
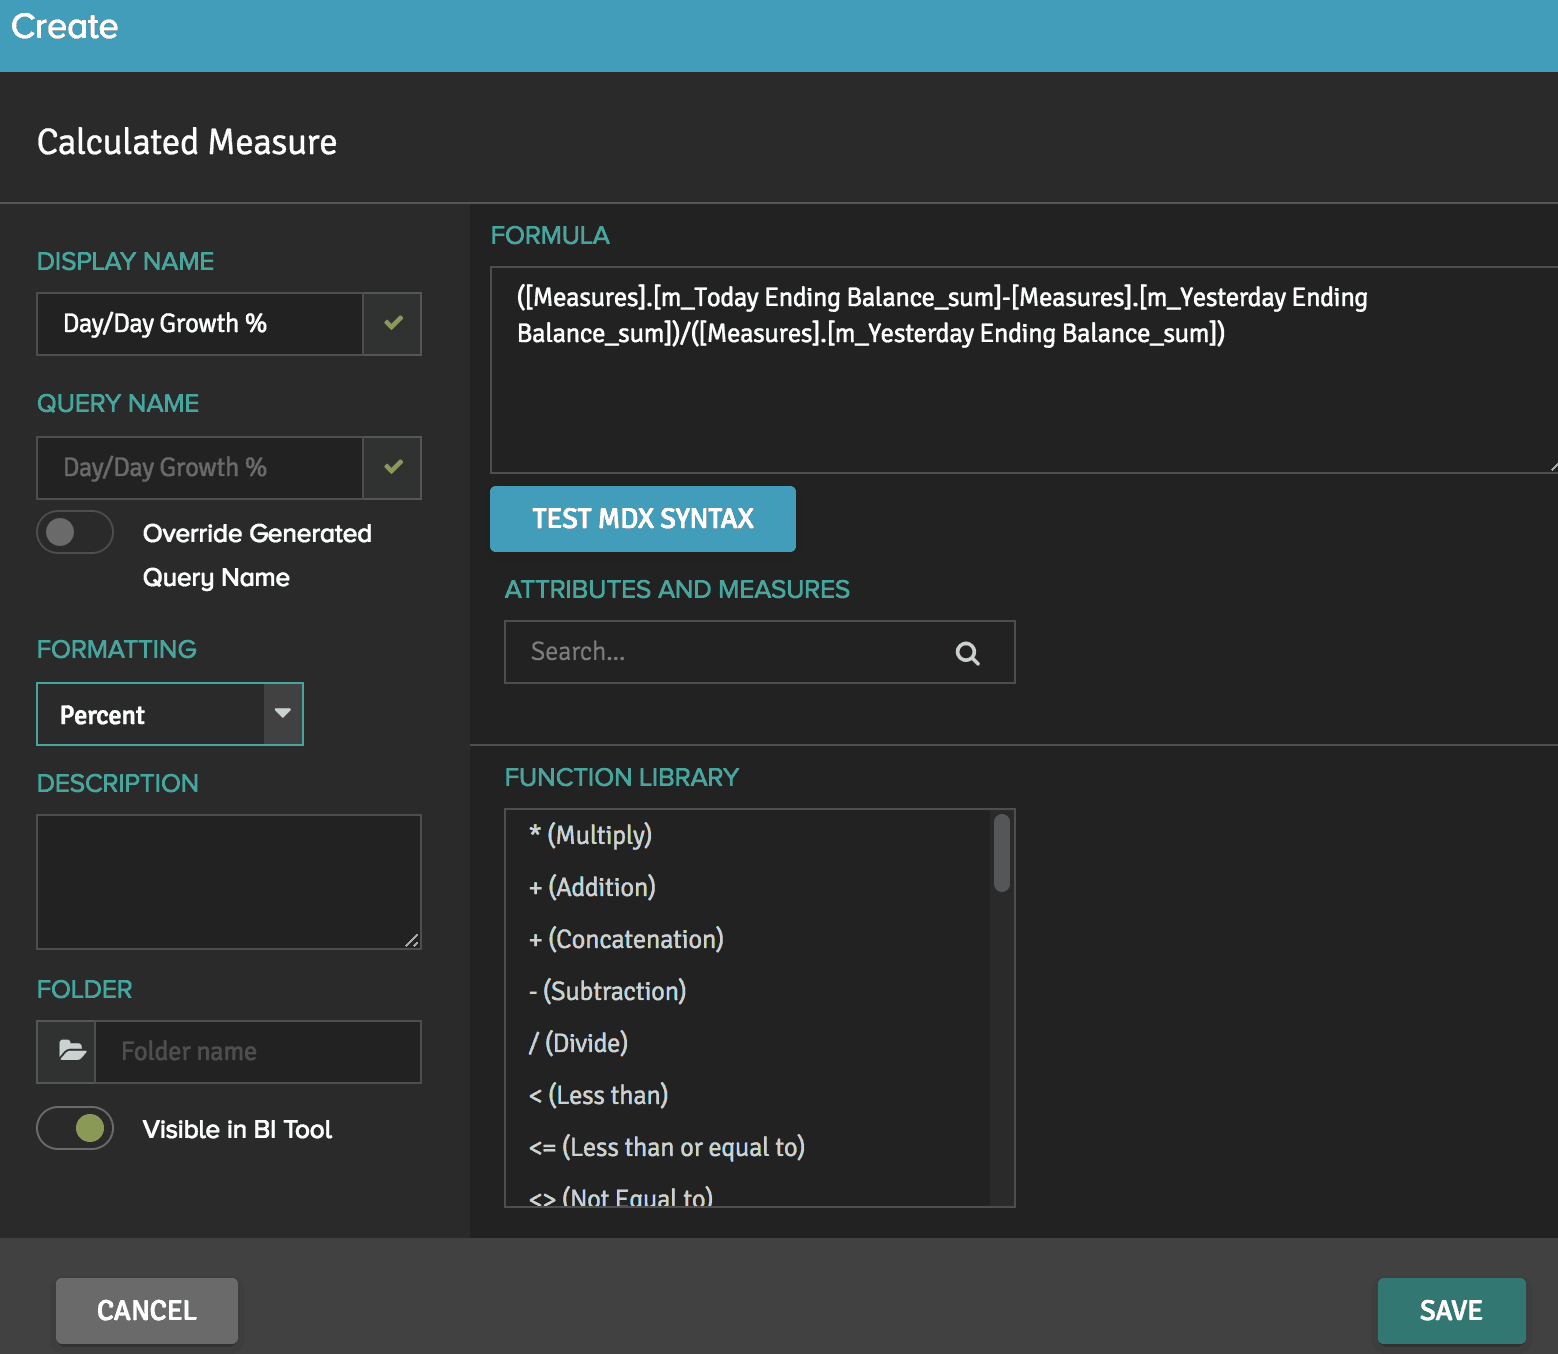
5. To Calculate Growth Percentage of Ending Balances, such as between Today and Yesterday, we would need to apply a formula similar to this:
— (Today – Yesterday) / Yesterday *100
— In the formula box, type in the formula by using the column names in the Calculated Columns. (Start typing “Today” and it will ask you to auto-complete with the proper column name)
— Select “Percent” in the Formatting box

— You will now see the new Calculated Measure.
— Once you publish the project, you will now see all the new Ending Balances columns and the Growth Calculated Measures in your reporting tool.
CONCLUSION:
Because companies in the financial services industry run their businesses on these type of metrics, the value of being able to accomplish these calculations in modern analytics is massive. As data platforms and compute technologies continue to evolve, the ability to easily perform these types of calculations often gets left behind. AtScale’s intelligent data fabric bridges this gap by enabling straightforward calculation of complex business rules on our innovative multidimensional interface, while providing great performance and agility to immediately bring answers to business analysts’ most pressing questions.
SHARE
Case Study: Vodafone Portugal Modernizes Data Analytics