The data economy is being embraced worldwide across industries because companies that are data driven show improved business performance. In fact, data has given companies such as Netflix, Facebook, Google and Uber a distinct competitive advantage.
Although nearly every company today is looking to leverage data and analytics to improve the bottom line, most organizations struggle with poor data quality. But how exactly do you define data quality and what’s the impact on the business?
Read on to learn more about how to improve data quality with clear and consistent data definitions using a semantic layer.
What is Data Quality?
The short answer is: High-quality data that’s fit for use in operations, compliance, and decision making. Data is also closely related to data definitions, which are descriptions of the data’s attributes. Comprehensive and consistent data definitions should be:
- Concise: Described as succinctly and clearly as possible.
- Precise: Described using unambiguous words when possible.
- Non-Circular: The term being described should not be used in the definition.
- Distinct: Described in a way that differentiates the data element, data entity or concept from others.
- Unencumbered: The definition should not refer to a physical location or how it is created.
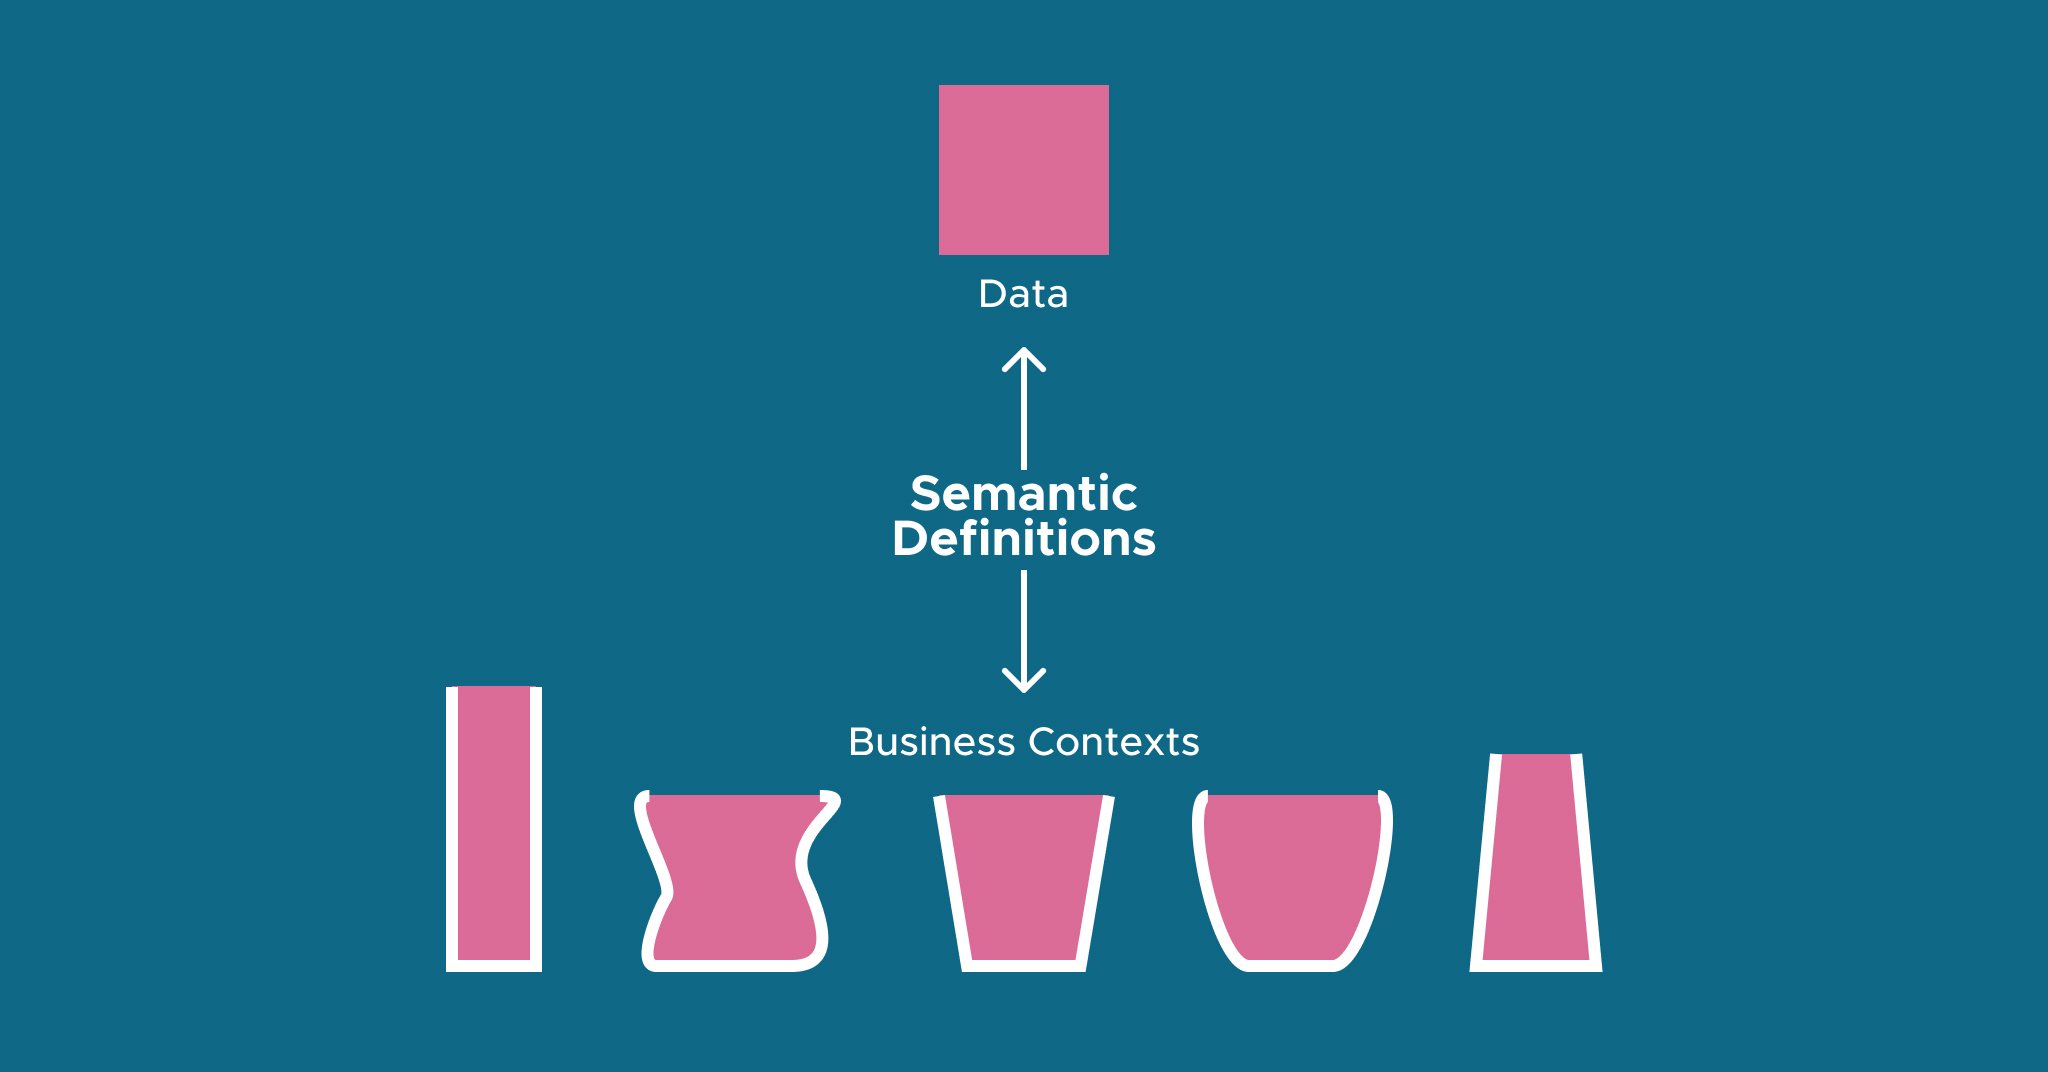
The real challenge with improving data quality is defining the data from a semantic or business view because context plays an important role in the way business users access, communicate, interpret, and consume data.
The Impact of Semantic Data Definitions
As mentioned before, semantically defining the data is based on the context in which the business users consume the data to achieve business-oriented outcomes. Here are a few examples of situations where semantic data definitions are crucial:
- Stakeholder views: While a vendor is looked at as a service provider by procurement, finance looks at the same vendor from a cost and budgeting perspective. Are vendor payment terms a service element or a cost element? If there’s no semantic definition, there will be disagreements when it comes to managing vendor relationships.
- Value chain impact: Is the customer a prospect or an account? How is an employee different from a vendor? Unless one defines customers, vendors, and employees semantically based on their impact in the business value chain, there will be misunderstandings on the use of data related to this.
- Business process differences: At a financial services company, does processing the credit application start when the adjudicator receives the file or when the processing of the previous credit application is completed by the adjudicator? Unless the start time is clearly defined there could be multiple interpretations.
Four Methods for Handling Data Definitions
There are four main ways to handle this data definition problem:
- Master Data Management (MDM): enabling business and IT teams to work together to provide a trusted, single version of the truth. This includes defining the data, formulating the business rules, setting up the workflows, roles mapping, formulating the governance policies, processes, procedures, standards, nomenclature and taxonomies.
- Data Integration Methods: fixing the inconsistent versions and definitions of the data in different IT systems with data integration tools. Selecting the right tools depends on factors like capabilities of APIs, number of transactional systems, and the sequence of transfer, transpose and orchestration.
- Data Wrangling: cleansing the data in the canonical system like the data warehouse or data mart. This includes formatting, de-duping, renaming, correcting, improving accuracy, populating empty data attributes, aggregating, blending and any other data remediation activities that help to improve the data quality.
- Semantic Layer: using a business representation of data that helps users access data using common business terms. A semantic layer maps business data into familiar business terms to offer a unified, consolidated view of data across the organization.
Implementing a Semantic Layer
A semantic layer can be a great option for companies that have a disparate set of data sources and are struggling to unify their data definitions. Here are five essential steps for implementing a semantic layer.
Step 1: Identify the use cases
While most use cases describe the role the system should perform, meaningful use cases should also identify the problem or opportunity owner, potential risks, and the business benefits in monetary terms. Also critical to success is having active subject matter expert (SME) engagement to ensure that there is expert representation of the business knowledge and understanding of the data.
Step 2: Identify business KPIs and ownership
Every meaningful initiative starts with a purpose that can be measured and owned, so it’s important to select relevant KPIs based on the strategy and business objective. It’s also advisable to have a leader who is very close to the business and data to own the KPI.
Step 3: Build data literacy in the enterprise
The success of any initiative requires a strong commitment, and one effective way to encourage data ownership is by improving education or awareness. Data literacy is the ability to understand and communicate data and insights, which is crucial when shifting to a data-centric organization that implements a semantic layer.
Step 4: Define the relevant data attributes
After completing the last four steps, you are now equipped to define the data attributes technically and semantically. The technical data definition includes information such as format, type, length, and other metadata characteristics. The semantic or functional view defines the data attributes from a business point of view.
Step 5: Implement the semantic layer platform
Now you’re ready to implement the semantic layer itself. The semantic layer platform links the analytics consumption tools with the data platforms using facts (data values), dimensions (data attributes) and hierarchies (taxonomies). By abstracting the physical form and location of data, the semantic layer platform makes data stored in the canonical data platforms accessible with the one consistent and secure interface for the business users.
Improve Data Quality with a Semantic Layer
Though enterprises have been using semantic layer tools to manage data for a long time, the data landscape has changed significantly in the last few years due to the increased adoption of big data, cloud data warehouses, self-serve analytics, and more.
Companies need quicker and better insights, but many of them have deployed numerous data and analytics solutions across diverse data platforms, resulting in data and insight silos. In addition, this distributed approach has created challenges in improving data quality, literacy, adoption and ultimately business performance.
The semantic layer acts as middleware between the data sources and the analytics platforms by providing virtualized connectivity, modeling, and other data management features. Because all the data required to derive insights from analytics is filtered through the semantic layer, data scientists and business users can see the same data in one consistent way. In short, the semantic layer makes data actionable.
Read the full white paper to learn more about implementing a semantic layer to improve data quality: Demystifying the Semantic Layer for Smarter, Faster AI and BI.
—
This article was written by Dr. Prashanth Southekal, the Managing Principal of DBP Institute (www.dbp institute.com), a data and analytics consulting, research, and education firm. He is a Consultant, Author, and Professor. He has consulted for over 75 organizations including P&G, GE, Shell, Apple, and SAP. Dr. Southekal is the author of two books – “Data for Business Performance” and “Analytics Best Practices” – and writes regularly on data, analytics, and machine learning in Forbes.com, FP&A Trends, and CFO.University. Apart from his consulting pursuits, he has trained over 3,000 professionals worldwide in Data and Analytics. Dr. Southekal is also an Adjunct Professor of Data and Analytics at IE Business School (Madrid, Spain) and an Instructor a TDWI. CDO Magazine included him in the top 75 global academic data leaders of 2022. He holds a Ph.D. from ESC Lille (FR) and an MBA from Kellogg School of Management (U.S.). He lives in Calgary, Canada with his wife, two children, and a high-energy Goldendoodle dog. Outside work, he loves juggling and cricket.
SHARE
2026 State of the Semantic Layer