July 1, 2020
The Cost of Bad Data
If you have been following our content for a while, you are most likely familiar with the concept of a Universal Semantic Layer™. What are the options for delivering one? In a recent webinar, I shared four ways.
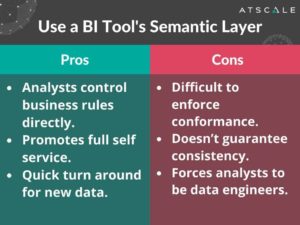
Option #1: Use a BI Tool’s Semantic Layer

What are the pros?
Well, first of all, your business is going to love it. Your business analysts are going to have complete control of their lives. They can control their business rules, they can create new business rules and they can do all that within the confines of a tool that they already know and love like Tableau or PowerBI. It’s self-service at its finest. As long as they have a connection to a database or data warehouse, they can go roll the room, and that’s full freedom. Business analysts have control, they can deliver results, as quickly as they prioritize them as long as they have access to that raw data.
What are the cons?
It’s really difficult to enforce conformance. I know that all of the BI tools look to say, “Hey, we have a way of providing governance”. The fact is that if you can create a calculation in a BI tool and in a report, you don’t have governance. That calculation can be a difference. I can name it for example, a page view, and I can define that page view calculation anyway, I want. There’s just no way that you can actually confirm that. Using a BI tool’s semantic layer definitely doesn’t guarantee consistency, because, again, people can use the same words and it can have different meanings. The bad thing here, is that it really forces the business analyst to be a data engineer. You hear terms like “data wrangling”, you can see that Tableau started out as a visualization tool and now they have a built in ETL data prep tool. And to me, that’s a bad thing. Do you really want your business users who are supposed to be running the business and figuring out how to improve profitability and improve customer experience actually becoming data engineers to do their jobs? That makes no sense to me.
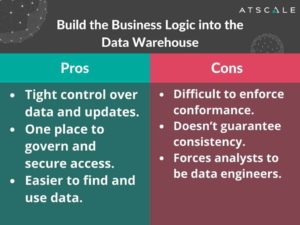
Option #2: Build the Business Logic into the Data Warehouse

What are the pros?
So let’s talk about the second option, which is building the business logic into the data warehouse itself. With this approach, there is super tight control over data and updates and it’s all centralized. This is good and you can feel confident that you’ll have complete control over that data. You can also have one place to secure and governance, which is terrific. It’s easier to find and use data if it’s all in one place, as opposed to business users having to go to multiple places, wherever the data landed and then having to do their own integration on their own.
What are the cons?
While it’s not a technology problem with centralizing everything on a data warehouse, it’s really a workflow problem. It creates a bottleneck where your users are waiting for data.
IT also doesn’t always understand the business. They definitely don’t understand the business as well as the business and business users do. You’ll find yourself in a terrible process of having the business users explain to the IT guys what the business rules are, so they can encode them into the data warehouse and deliver them what they need. That’s just a lot of back and forth and creates a lot of room for error. Just because you have tables and tables, maybe beautifully normalized with a star schema, you still need to create those calculations, combine them and create dashboards that make sense.
And again, that still leaves a lot of room for error because the business analyst can still get it wrong. I call this option, “It takes how long?!”. I’ve heard, “It takes X amount of weeks to code it up, X amount weeks to QA it and X amount of weeks to do UAT.” And then of course the business user has to be involved in that process. It just takes a long time and that’s just the way it is when you’re trying to build one monolithic data store.
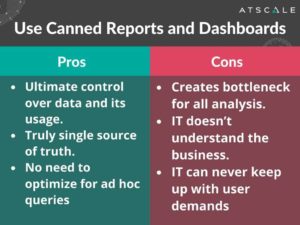
Option #3: Use Canned Reports and Dashboards

What are the pros?
I’ve seen a few companies do this. This is almost impossible to do in the enterprise. If there’s canned reports and dashboards, they’re probably being created by a central group. It could be a data group, IT or it could be both. Regardless, it’s the ultimate control of data and its usage. The business terms, as well as the data behind those business terms are completely baked in and you can do limited drop-downs for doing filtering. There truly is a single source of truth because there’s not much room for customization here. For IT, you don’t have to worry about ad hoc queries. It’s great. You can say “I have a process where this gets updated “N” times per day usually “N” is one. Everybody gets the same thing and you don’t have to worry about ad hocs. You don’t have to worry about crazy business users who are running queries that are going to run and bring down my systems.
What are the cons?
The bottleneck that we’re becoming a little too familiar with. And this time, it’s even worse than the single data warehouse. For the single data warehouse, the business had the ability to create an author, their own reports and dashboards. In this case, there’s absolutely no freedom of control. And IT, again, doesn’t understand the business, so now you’re asking them to do even more than they did before. There’s no way that they could ever keep up with the demands of the business, because now they’re not just trying to prep data and make it available for consumption, they’re also trying to produce the visuals, and analytics themselves in addition to the raw data.
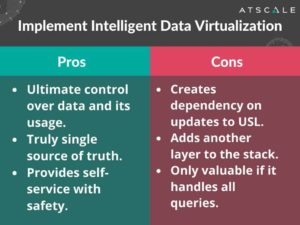
Option #4: Implement Intelligent Data Virtualization™

Let’s talk about Intelligent Data Virtualization™. I call it “freedom within a framework”. Of course, I’m partial to this. I started AtScale to accomplish this, so I can tell you that I think that this is the best option out there.
What are the pros?
When creating a Universal Semantic Layer™ using data virtualization, you have ultimate control over its data and its usage because not only are you defining, where the data is within the visual and the data virtualization layer, you’re also defining the business metrics. Those are the metrics that will be used consistently without forcing users to use a certain set of tools. With intelligent data virtualization, there is a single source of truth because no matter where the data is coming from, it’s going to be defined and related, the same way which provides a level of self-service. Users can still use their visualization and BI tools or their AI tools, but they’re going to be working with those with safety.
What are the cons?
So what are the cons? It does create a dependency. If there’s a Universal Semantic Layer™, that data virtualization layer, there needs to be somebody who’s curating that and making that available. There’s no hiding that. It does take some control away from that business user and it does add another layer to the stack as well. It really is only valuable if it handles all the queries. So here’s what I’m going to tell you. It’s not about just a semantic layer, it’s the “U” in universal that is critical. So if it’s not universal, forget about it. Having a semantic layer for Tableau and having a semantic layer for PowerBI, and having a semantic layer for Cognos; that does you no good whatsoever, because now you have three semantic layers and of course there’s going to be differences. If you do this right, you can give your users freedom within that framework.
Intelligent Data Virtualization™ = A Universal Semantic Layer™
According to Gartner, people this year will be spending 45% less if they’re using virtualization and that’s very different than what people normally do. Data virtualization gets rid of that data movement, and it gets rid of all sources of errors that are going to result in inconsistent data.
Related Reading:
ANALYST REPORT