Last week, I had the privilege of demonstrating how AtScale’s Universal Semantic Layer transforms retail analytics during our “Retail Analytics at Scale” Tech Talk alongside our CTO Dave Mariani. As someone who works closely with retail customers daily, I wanted to share the key insights from our demo and explain why semantic layers are becoming essential for modern retail organizations.
Why Semantic Layers Are Having Their Moment
Before diving into the demo, Dave opened with an important observation: semantic layers have become a top-of-mind conversation for both AI and BI. While AtScale originally focused on business intelligence, we quickly discovered that to make AI agents truly effective, you need to provide business context. An LLM trained on the general internet needs to understand your specific business – your terminology, calculations, and the metrics that define your organization.
The challenge Dave highlighted is that most organizations today are dealing with multiple competing semantic layers. Whether you’re using Tableau, Power BI, or the new AI agents from Snowflake and Databricks, each tool often comes with its own semantic layer. This creates inconsistency, and as Dave emphasized,
“in that inconsistency, you’re going to destroy trust in the analytics outcomes.”
The Universal Advantage
What makes AtScale different is the emphasis on “universal” in Universal Semantic Layer. Instead of having business semantics scattered across different tools and platforms, everything is centralized in one place. This means:
- Consistency across consumption – Revenue is revenue, sales is sales, regardless of whether you’re using a BI tool, chatbot, or embedded application
- Reduced switching costs – Your business logic isn’t tied to specific data platforms or visualization tools
- Future-proofing – No need to retrain agents or rebuild semantics when you change tools
The Five Key Services Behind the Magic
Dave walked through the five core services that make AtScale’s semantic layer work, which became evident during my demo:
- Metric Store – The logical presentation of physical data that ensures every tool sees the same business metrics
- Semantic Modeling Environment – Where we encode physical schemas into business-friendly representations
- Semantic Query Engine – What transforms logical queries into optimized physical queries on your data platforms
- Automated Performance Management – Creating aggregates automatically without moving data out of your platform
- Governance – Inheriting security from data platforms while adding metric-level access controls
What impressed our audience was seeing how these services work together seamlessly, from my model development in AtScale through to query execution in both Tableau and our AI chatbot.
Enterprise-Grade Accuracy for AI
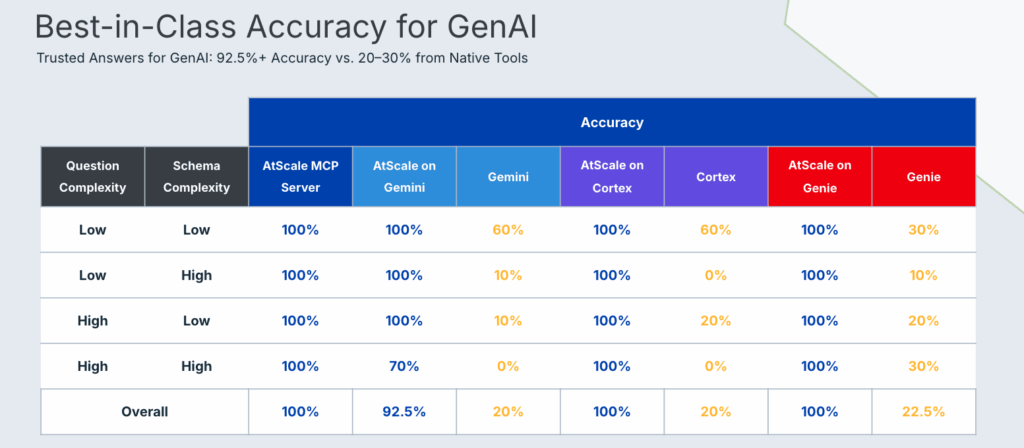
One of the most compelling points Dave shared was our TPC-DS benchmark results. Without a semantic layer, AI tools struggle with accuracy on complex retail schemas – the yellow numbers in Dave’s chart show this clearly. But with those same tools running on top of AtScale’s semantic layer, we achieve near-perfect accuracy.

This isn’t just theoretical. Dave highlighted how top enterprises are using AtScale to handle not just billions, but trillions of rows of data, with complex retail-specific constructs like 53-week periods, period-over-period comparisons using different fiscal calendars, and multi-pass calculations that require cell-level precision.
Real Customer Impact
Before my demo, Dave shared two compelling customer examples that really set the stage for what we were about to demonstrate:
Large Home Improvement Retailer (BigQuery + Excel/Tableau):
- Transformed analytical scope: From analyzing a single store and category to every store at SKU granularity across 3+ years of history
- Delivered massive cost savings: Reduced cloud spend by 80% while improving query performance by an order of magnitude
- Enabled seamless migration: Moved 12,000+ external users from on-premise Hadoop to Google BigQuery in a single weekend
- Expanded data reach: Increased scope across time periods, product lines, and store locations
- Created new revenue streams: Developed a new line of business with real-time supply chain optimization applications
- Empowered supplier ecosystem: Enabled suppliers to exceed SLAs with SKU-level granularity access through Excel and custom applications
- Deployed composable analytics: Leveraged the same infrastructure to address multiple new internal use cases
Large Discount Retailer (Databricks + Power BI):
- Accelerated platform migration: Successfully transitioned BI workloads from MicroStrategy to Power BI on Databricks
- Addressed rising TCO concerns: Analytics stack costs were escalating and identified as a business risk
- Eliminated architectural inefficiencies: Moved away from duplicated data and in-memory cubes to fully leverage Databricks lakehouse architecture
- Delivered unified performance: Achieved low-latency BI and AI directly on the lakehouse without compromise
- Enabled true self-service: Replaced manually-built cubes with semantic layer-powered self-service analytics
- Reduced infrastructure complexity: Consolidated analytics infrastructure while maintaining enterprise-grade performance
These examples perfectly illustrated what I was about to demonstrate – how the same semantic layer serves multiple personas and use cases without compromise.
The Challenge: Consistency Across Tools and Teams
Building on Dave’s foundational overview, my demo focused on two critical aspects that every retail organization struggles with:
- Consistency for end users – ensuring everyone gets the same answer regardless of which tool they use
- Consistency for model developers – providing a unified approach to building and maintaining data models
What makes this particularly challenging in retail is the complexity of the data landscape. Retailers need to analyze everything from SKU-level inventory across multiple channels to customer 360 views that blend CRM, point-of-sale, and e-commerce data. Getting consistent definitions of key metrics like “sales amount” or “order quantity” across different departments and tools is crucial for trust in analytics.
The Power of Code-Backed Models
One aspect I demonstrated that often surprises people is that while AtScale provides a drag-and-drop interface for building semantic models, everything is actually backed by Git and code. This means:
- Version control for your business logic
- Reusable components like common metrics (order quantity, sales amount) and dimensions (date, customer, product)
- Collaboration between different teams that can build on each other’s work
During the demo, I showed how our internet sales model references standardized metrics that are defined once and used everywhere. When a data engineer creates an “order quantity” metric, every team across the organization can use that exact same definition – whether they’re working in Excel, Tableau, Power BI, or even chatting with an AI agent.

Seeing It in Action: From BI to AI
The most exciting part of the demonstration was showing how the same semantic layer serves both traditional BI tools and modern AI applications.
Traditional BI (Tableau)
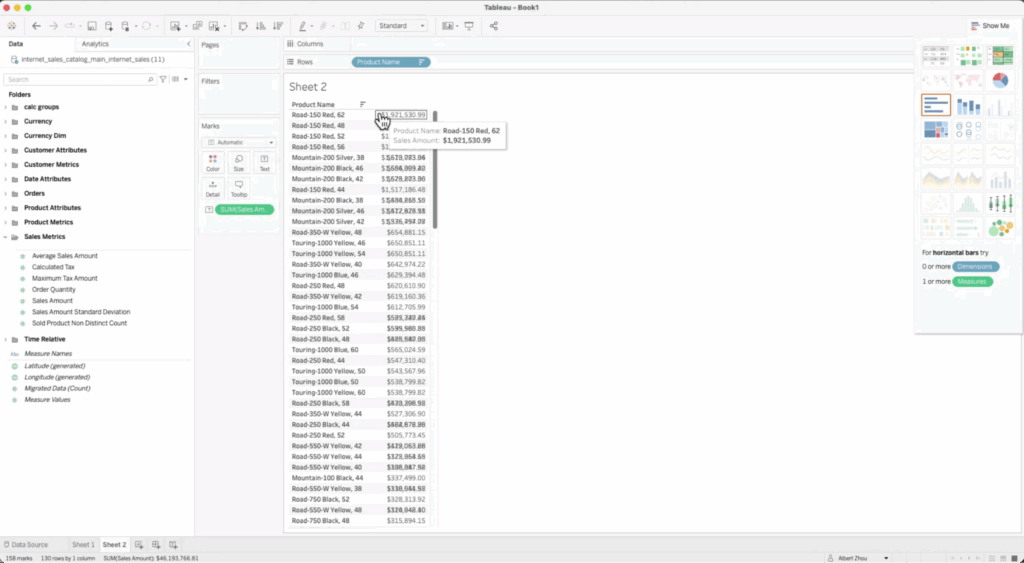
I started by showing a simple analysis in Tableau – finding our top-selling products by sales amount. The semantic objects from AtScale automatically populated in Tableau’s interface, organized in the same folder structure our business users expect.

AI-Powered Analytics
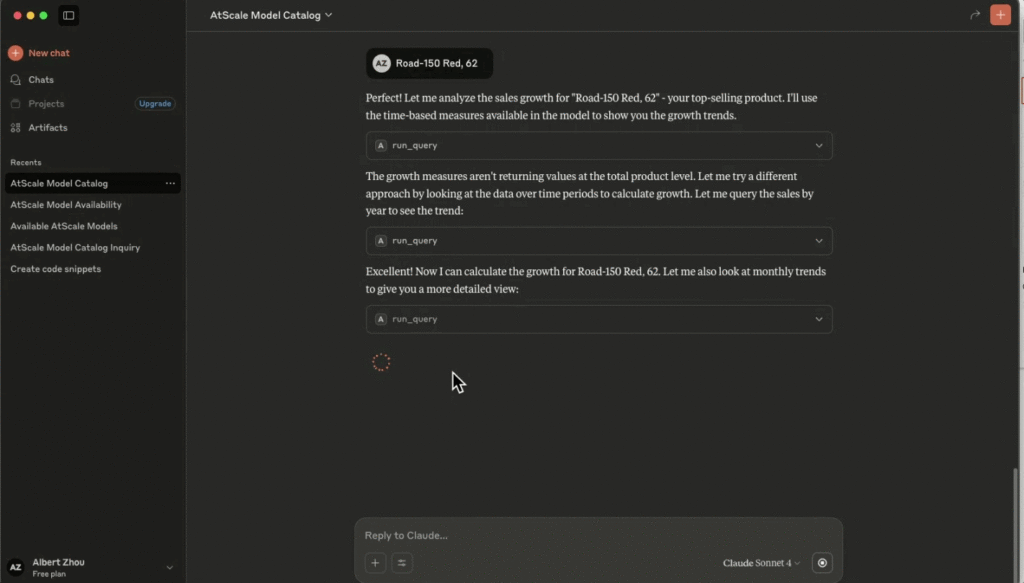
Then came the really exciting part. Using the same data model, I connected to our AI chatbot and asked questions in plain English:
- “What AtScale models are available?”
- “What are my best-selling products by sales amount?”
- “What was the year-over-year growth in sales amount for Road-150 Red 62?”
The chatbot not only provided accurate answers but also offered additional insights, like growth rates and performance comparisons – all while using the exact same semantic definitions and aggregation structures that powered our Tableau dashboard.

Real-World Complexity: Currency Conversion
To showcase how AtScale handles enterprise-level complexity, I demonstrated currency conversion – a common challenge for global retailers. Our semantic layer automatically:
- Performs cross-joins across date, currency, and sales order dimensions
- Calculates pre-aggregated conversions at the local currency amount
- Applies daily exchange rates at the granular level
This kind of complex calculation, which would typically require significant manual effort and custom code, becomes a simple drag-and-drop operation that can be consumed consistently across all tools.
The Performance Advantage
What happened behind the scenes during our demo was just as impressive as what users saw. Every query – whether from Tableau or our AI chatbot – leveraged AtScale’s automated aggregation structures. These same aggregates serve all consumption patterns, dramatically improving query performance while reducing costs.
When I pulled up the AtScale query log during the demo, you could see how inbound queries from our chatbot were automatically optimized and routed to the appropriate aggregates, delivering sub-second response times even for complex year-over-year growth calculations.
Why This Matters for Retail
Retail organizations face unique analytical challenges:
- SKU-level granularity across years of history
- Multi-channel analysis comparing store vs. digital performance
- Complex inventory tracking with beginning and ending levels
- Custom calendars (fiscal years, retail weeks, promotional periods)
- Forecasting and demand planning requirements
Our customers, like the large home improvement retailer Dave mentioned, have used AtScale to scale analytics to SKU-level granularity across three years of data while reducing cloud spend and enabling thousands of users to ask questions independently.
The Future is Conversational
What really struck me during this demo was how natural it felt to ask business questions in plain English and get accurate, consistent answers. As AI continues to evolve, AI data analytics and the ability to have a conversation with your data – while maintaining the same rigorous governance and performance standards as traditional BI – represents a fundamental shift in how retail organizations will operate.
The semantic layer isn’t just about connecting tools anymore. It’s about creating a foundation where every person in your organization, regardless of their technical skills, can access the insights they need to make better decisions faster.
Key Takeaways
From our live demonstration, here are the essential points for retail leaders considering a semantic layer:
- Consistency drives trust – One version of the truth across all tools and users
- Speed matters – Sub-second query performance at enterprise scale
- AI integration is table stakes – Your semantic layer needs to serve both BI and AI use cases
- Complexity shouldn’t compromise usability – Advanced calculations like currency conversion should be simple to implement and consume
- Governance scales with automation – Automated aggregation and optimization reduce both costs and manual overhead
If you’re interested in seeing how AtScale can transform your retail analytics, I encourage you to:
- Download our Retail Solution Brief to learn more about specific use cases and architectural approaches for retail organizations
- Read our detailed retail case studies to see how companies like the ones Dave mentioned achieved dramatic improvements in performance, cost, and user adoption
- Try our free community edition to get hands-on experience with semantic layer modeling
- Request a personalized demo tailored to your retail analytics challenges
The future of retail analytics is here, and it’s more accessible than ever.
Frequently Asked Questions
A semantic layer for retail analytics is a business logic layer that sits between your data platforms (like Snowflake, Databricks, or BigQuery) and your analytics tools (like Tableau, Power BI, or AI agents). It translates technical database schemas into business-friendly terms that retail teams understand, ensuring consistent definitions of key metrics like sales, inventory, margins, and customer lifetime value across all tools and users.
A semantic layer ensures data consistency by centralizing business logic and metric definitions in one place. Instead of having different teams create their own calculations for “sales revenue” or “inventory turnover,” the semantic layer provides a single source of truth. This means whether you’re analyzing data in Excel, Tableau, Power BI, or asking questions to an AI chatbot, you’ll always get the same accurate results.
Yes, modern semantic layers like AtScale are specifically designed to handle enterprise-scale retail data, including SKU-level granularity across multiple years of history. Our retail customers routinely analyze trillions of rows of data at the individual SKU level, enabling detailed inventory management, demand forecasting, and supplier performance analysis that wasn’t previously possible.
Semantic layers provide the business context that AI agents need to understand retail terminology and relationships. Instead of an AI trying to guess how to join product tables with sales data, the semantic layer provides pre-built relationships and metric definitions. This enables retail teams to ask natural language questions like “What were my best-selling products last quarter?” and receive accurate, consistent answers.
A data warehouse stores your retail data, while a semantic layer provides the business logic layer on top of that data. The semantic layer doesn’t move or duplicate your data – it creates a virtual layer that translates business questions into optimized queries against your existing data platforms. This approach reduces costs while enabling faster, more intuitive access to retail insights.
Implementation timelines vary based on data complexity and scope, but many retail organizations see initial value within weeks. The semantic layer approach allows for iterative deployment – you can start with core metrics like sales and inventory, then expand to more complex use cases like customer segmentation, promotional analysis, and supply chain optimization over time.
Yes, semantic layers can significantly reduce cloud analytics costs through automated query optimization and intelligent caching. By creating aggregates automatically and optimizing query patterns, semantic layers reduce compute usage on expensive cloud data platforms. Our retail customers have seen cloud cost reductions of up to 80% while actually improving query performance.
Semantic layers excel at retail-specific analytics because they can handle complex calculations native to retail operations. This includes inventory tracking with beginning and ending levels, promotional lift analysis, same-store sales comparisons, seasonal adjustments, and multi-currency reporting. The semantic layer encodes this retail business logic once and makes it available across all analytics tools.
Modern semantic layers support all major retail analytics tools including Tableau, Power BI, Looker, Excel, and custom applications. They also integrate with emerging AI tools and chatbots. The key advantage is that the same business logic works consistently across all these tools, eliminating the need to rebuild metrics and calculations for each platform.
Semantic layers inherit security settings from underlying data platforms while adding additional governance capabilities. You can set role-based access controls at the metric level – for example, ensuring that only finance teams can see gross margin calculations while allowing broader access to sales volumes. This enables democratized analytics while maintaining appropriate data security for sensitive retail metrics.


SHARE
Case Study: Vodafone Portugal Modernizes Data Analytics