October 18, 2019
Should You Build or Buy Your Universal Semantic Layer?
In my first blog of this series, The Semantics of the Semantic Layer, I laid out the seven core capabilities of a semantic layer. In this blog, I will dive deeper into how a semantic layer connects data to people, wherever they are and with whatever tool they prefer to use.
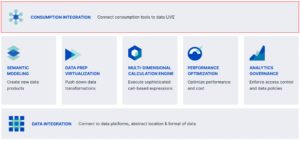
As a reminder, the following diagram shows the seven core capabilities of a semantic layer platform. This blog will focus on “Consumption Integration”, highlighted in red:

For a semantic layer to be truly universal, it needs to support “live” query connections for all user personas and for all popular query tools and programming interfaces.
More Than Just BI
A universal data layer is useful to more than just the business analyst and business intelligence personas. A semantic layer must also serve the needs of the data scientist and application developer.
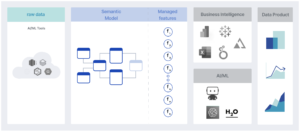
Let’s start with the data science persona. Like business analysts, data scientists also need access to consistent, business-friendly data for building and training their machine learning models. In addition to the ability to read (or consume) the semantic layer, data scientists also need to write their predictions and features back to the semantic layer. By supporting both reading and writing, the semantic layer and underlying semantic model becomes the bridge that spans the traditional business analytics and data science silos. The image below illustrates how the semantic layer unifies the workflows of the business analyst and data science personas:

In addition to business analysts and data scientists, application developers need simple interfaces into data to build data-driven applications.
By addressing all three personas, a semantic layer can deliver all four flavors of analytics, from descriptive and diagnostic (business analysts) to predictive (data scientist) to prescriptive (data scientist, application developer), becoming the unifying thread underpinning a full range of analysis and personas.
Key Takeaway: A semantic layer must support multiple consumer personas, including business analysts, data scientists and application developers, to deliver the full spectrum of data access and analysis.
More Than Just SQL
SQL was a godsend to database programmers because it became a standard for structured data access for a variety of data platforms. Since a semantic layer exists to provide data access to everyone, not just programmers and data engineers, SQL-only access limits users to tools that speak SQL or those who can write SQL.
While most tools do speak SQL, some tools like Excel (the most popular BI tool on the planet) and Power BI, don’t play nice with SQL. Rather, these tools prefer to speak in their native, dimensional dialects using MDX (Excel) and DAX (Power BI). Data scientists prefer to speak to their data using Python and data frames while application developers may prefer using REST, JDBC or ODBC interfaces.
For example, the following queries all answer the same question “how many water bottles did I sell by state in the US?”:
SQL (from Tableau)
SELECT `Internet Sales`.`CountryCity` AS `countrycity`,
`Internet Sales`.`Product Name` AS `product_name`,
`Internet Sales`.`State` AS `state`,
SUM(`Internet Sales`.`orderquantity1`) AS `sum_orderquantity1_ok`
FROM `sales insights – snowflake`.`internet sales` `Internet Sales`
WHERE ((`Internet Sales`.`CountryCity` = ‘United States’) AND (`Internet Sales`.`Product Name` = ‘Water Bottle – 30 oz.’))
GROUP BY 1,
2,
3
MDX (From Excel)
SELECT
NON EMPTY Hierarchize(
DrilldownMember(
{ { DrilldownLevel(
{ [Geography Dimension].[Geography City].[All] },,,
INCLUDE_CALC_MEMBERS
) } },
{ [Geography Dimension].[Geography City].[CountryCity].& [United States] },,,
INCLUDE_CALC_MEMBERS
)
) DIMENSION PROPERTIES PARENT_UNIQUE_NAME,
HIERARCHY_UNIQUE_NAME ON COLUMNS
FROM
(
SELECT
(
{ [Geography Dimension].[Geography City].[CountryCity].& [United States] }
) ON COLUMNS
FROM
[Internet Sales]
)
WHERE
(
[Product Dimension].[Product Dimension].[Product Line].& [S ].& [S ] & [28].& [477],
[Measures].[orderquantity1]
) CELL PROPERTIES VALUE,
FORMAT_STRING,
LANGUAGE,
BACK_COLOR,
FORE_COLOR,
FONT_FLAGS
DAX (From Power BI)
EVALUATE TOPN(
1001,
CALCULATETABLE(
ADDCOLUMNS(
KEEPFILTERS(
ADDCOLUMNS(
KEEPFILTERS(
FILTER(
KEEPFILTERS(
SUMMARIZE(
VALUES(‘Geography Dimension’),
‘Geography Dimension’ [City.Key0],
‘Geography Dimension’ [City.Key1],
‘Geography Dimension’ [City]
)
),
NOT(ISBLANK(‘CubeMeasures’ [orderquantity1]))
)
),
“orderquantity1_City_Key0”,
‘CubeMeasures’ [orderquantity1]
)
),
“orderquantity1”,
[orderquantity1_City_Key0]
),
KEEPFILTERS(
FILTER(
KEEPFILTERS(
VALUES(‘Geography Dimension’ [CountryCity.Key0])
),
‘Geography Dimension’ [CountryCity.Key0] = “United States”
)
)
),
[orderquantity1_City_Key0],
0,
‘Geography Dimension’ [City],
1,
‘Geography Dimension’ [City.Key0],
1,
‘Geography Dimension’ [City.Key1],
1
)
ORDER BY
[orderquantity1_City_Key0] DESC,
‘Geography Dimension’ [City],
‘Geography Dimension’ [City.Key0],
‘Geography Dimension’ [City.Key1]
As you can see, even though the questions and answers are the same, these tools produce wildly different queries in their native dialect. A semantic layer should handle all these dialects (and more), deliver the same sub-second query performance, apply the same governance filters and, of course, return the same results. For a semantic layer to be universal, it must bring data to its consumers and that means speaking the native language of the end users’ tool of choice, whether that be a business analyst, data scientist or application developer.
Key Takeaway: A semantic layer must support multiple inbound languages to support a wide range of data consumers using their preferred protocols. Semantic layer solutions that only support SQL or Javascript are unsuitable to serve as endpoints for a variety of popular consumption tools.
Zero Footprint
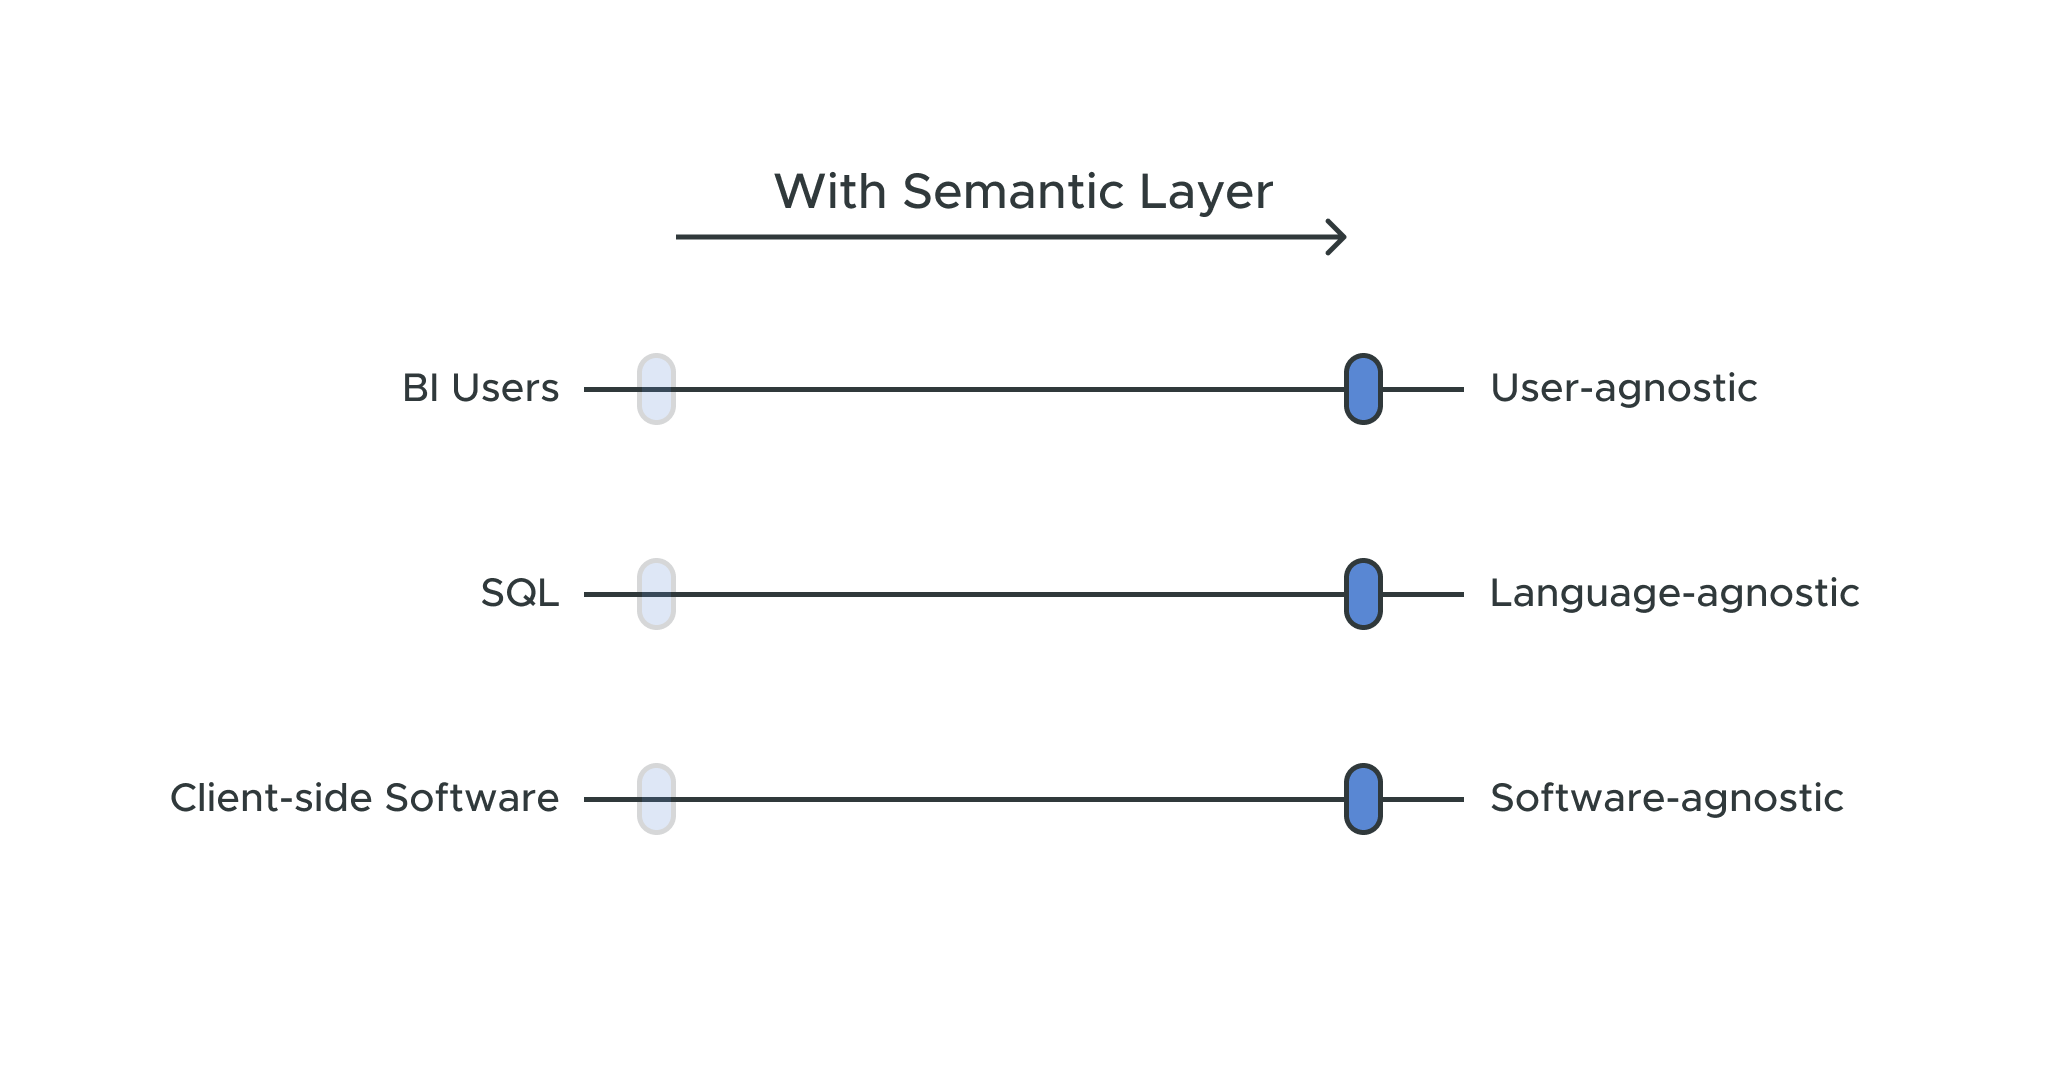
A semantic layer can’t deliver on its full potential if it’s not accessible and usable by everyone. In order to reach the largest number of users, a semantic layer shouldn’t require additional client-side software to make it work. This is harder than it seems because custom drivers or plug-ins are usually required to make query tools and applications work with most data platforms.
A well-designed semantic layer will leverage each query tool’s built-in connectivity for accessing the semantic layer. For example, AtScale uses the built-in SQL Server Analysis Services (SSAS) drivers in Excel and Power BI to connect to the AtScale semantic layer. This means that anyone with Excel can connect “live” to the AtScale semantic layer without any added software requirements.
Key Takeaway: A semantic layer should not require the IT team to install additional client software on query consumers’ machines.
Data for Everyone
Besides serving as a metrics hub, a semantic layer provides a business-friendly interface to data for all consumer personas, tools and dialects. A semantic layer truly democratizes data access by turning everyone into a data-driven decision-maker. In my next post, part three of eight, we’ll dive into the semantic layer’s semantic data model for mapping your digital assets to the business. In the mean time, if you’d like to skip ahead, download the white paper “The Semantics of the Semantic Layer”. It dives deep on the 7 key requirements and shares a decade of experience making it work for real, demanding Enterprise customers.


ANALYST REPORT