Resource Library : Tutorials
Connect Grok to AtScale
This guide shows how to connect Grok CLI or Grok web to AtScale via MCP. Once connected, Grok will have access to AtScale’s models, enabling you to ask questions about your business data in natural language and get answers built from your own metric definitions.
Before you start
You need:
- Grok CLI installed or Grok web, and you are signed in
- An AtScale instance available to open ports with MCP server enabled
- Admin or application_admin role assigned in the Identity Broker
- At least one published model
- Credentials with read access to that model
Don’t have an AtScale environment yet? Book a demo.
Get your AtScale Client Secret and Remote MCP URL
Get your Client Secret:
In AtScale, go to Security → Clients → atscale-mcp → Credentials and copy the Client Secret.
! Do not regenerate the client secret !
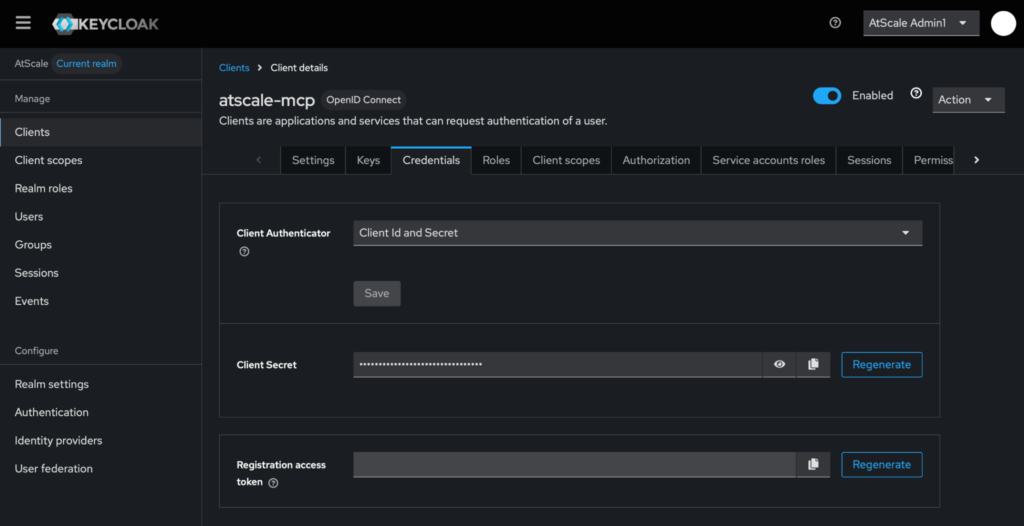
A note on the Client Secret. You’ll sign in to AtScale through your browser. Grok never sees your password, and AtScale resolves you to your own role, so you see exactly the models, columns, and rows your account permits.
Get your Remote MCP server URL:
In AtScale, go to Security → Clients → atscale-mcp.
Scroll down to Access Settings where you will see your Root URL. Your Remote MCP server URL is your Root URL with “/mcp” added to the end. For example: https://atscale.example.com/mcp
Configure the MCP in Grok CLI
Go to ~/.grok/config.toml and paste in the code block below with your remote MCP server URL.
[mcp_servers.atscale-local]
url = “https://atscale.example.com/mcp”
enabled = true
oauth_client_id = “atscale-mcp”
oauth_client_secret_env_var = “ATSCALE_MCP_SECRET”
Set ATSCALE_MCP_SECRET as an environment variable to your client secret and replace https://atscale.example.com/mcp with the remote MCP server URL for your AtScale instance, with /mcp added to the end.
If you edited config.toml while Grok was running, exit and reload grok.
Authenticate and confirm the connection
Open the MCP panel in Grok CLI:
/mcps
You should see atscale-local listed.
Select atscale-local and click enter sign in. Your browser opens to your AtScale instance’s login page. Enter your credentials and sign in. The browser hands control back to Grok, which stores the tokens in ~/.grok/mcp_credentials.json.
Back in /mcps, atscale-local should now show as connected with its tools loaded.
Confirm it works by asking a question that exercises the connection:
What AtScale models and measures do you have access to?
You should get back a list of any models you have deployed, and a list of measures and dimensions.
Connect Grok on the web
The CLI runs on your machine, so it can reach an AtScale instance on localhost. Grok on the web cannot, xAI’s servers call your MCP server directly, so the instance needs a public hostname and a valid TLS certificate.
Before you start
Everything from the CLI section applies, plus:
- Your AtScale instance is reachable over the public internet on a resolvable hostname with valid TLS
- Your atscale-mcp client accepts https://grok.com/connectors-oauth-exchange-code/ as a redirect URI
- On Business and Enterprise plans, an admin provisions the custom connector in the xAI console before members can add it
Register Grok’s callback
In AtScale, go to Security → Clients → atscale-mcp → Settings and add https://grok.com/connectors-oauth-exchange-code/ to Valid Redirect URIs.
Add the connector
- Go to grok.com/connectors
- Click New Connector, then Custom
- Server URL: your Root URL with /mcp appended, e.g. https://atscale.example.com/mcp
- Client ID: atscale-mcp
- Client Secret: the value from the Credentials tab
- Leave the auto-discovered endpoints as they are
Click Add Connector, then complete the AtScale sign-in when prompted. Grok discovers the tools your server exposes and makes them available in conversations.
Confirm it works
Ask:
What models are available?
You should get the models your account can reach. As with the CLI, queries run under your own identity, so you see only what your roles permit.
Ask your data a question
Grok now has access to your models. Start with something you can check: a metric you’d recognize from a dashboard or report.
What was total [your metric] for [period]?
Compare the answer to what your BI tool reports. They should match, because both are reading the same definition from the same model.
Now ask something that you couldn’t ask on a dashboard.
Where do we have opportunities to improve efficiency?
Grok plans an approach, runs several queries against your model, and reasons over the results. This type of analysis would take a lot of clicking and pivoting in Excel or Power BI. Now, Grok brings the reasoning, your model brings the definitions.