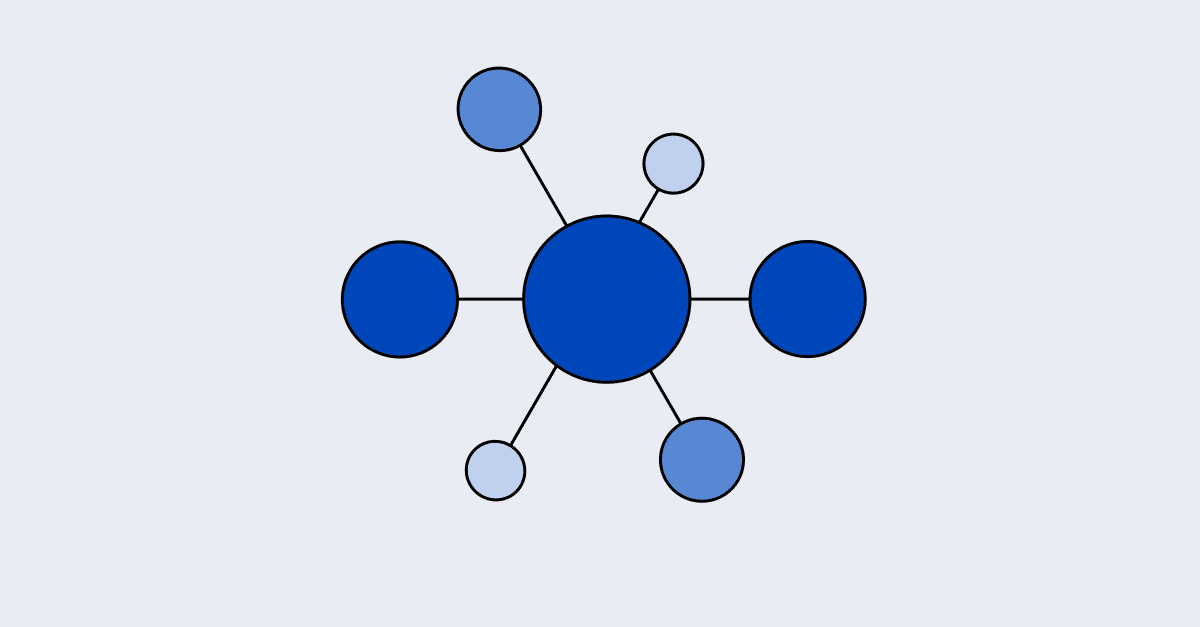
Today’s enterprise analytics environments are rarely centered around a single BI tool. Most organizations operate a patchwork of visualization and analysis platforms: Power BI for some teams, Tableau for others, Looker in pockets, and Excel still dominating finance workflows.
This multi-BI setup poses a serious challenge: how do you ensure consistent metrics, dimensions, and business logic across all tools, while maintaining governance and performance?
The AtScale semantic layer platform was built to answer that question. We’ve helped hundreds of enterprises overcome these hurdles. We’ll outline how in this article. The short version: connect Power BI, Tableau, Looker, and Excel to one universal semantic layer that sits above your data warehouse, define your metrics and business logic there once, and every tool inherits the same governed numbers instead of maintaining its own copy.
What Makes Scaling Semantic Models So Difficult?
Organizations face several critical challenges when attempting to scale semantic models across multiple BI tools:
Metric Inconsistency and the “Trust Gap”
When each BI tool maintains its own semantic model:
- Core metrics like “Revenue” or “Customer” get defined differently
- Reports show conflicting numbers across tools
- Executives lose trust when they receive contradictory insights
- Teams hesitate to act because no one agrees on the data
As one AtScale customer, a Fortune 100 healthcare company, told us:
“Before implementing a unified semantic layer, our executive meetings started with 15 minutes of arguing about whose numbers were correct. The trust gap was undermining our entire analytics investment.”
Redundant Development and Maintenance
Tool-specific models are resource-intensive:
- Rebuilding the same metrics across tools
- Siloed teams developing in isolation
- Repeating maintenance with every business rule update
- Inconsistent enforcement of governance policies
Performance and Scalability Limits
Without central optimization:
- Queries slow down as data volumes grow
- Infrastructure silos emerge with duplicate data processing
- User experience becomes uneven from one tool to another
- Cloud costs rise from inefficient compute usage
Fragmented Governance and Security
When security models vary by tool:
- Access control is inconsistent
- Audit trails are incomplete
- Regulatory compliance becomes harder
- Security policies must be re-implemented for each platform
Why Tool-Specific Solutions Fall Short
Many organizations attempt to solve these challenges with tool-specific approaches. Let’s examine why they typically fall short:
The Power BI-Centric Route
Many orgs lean on:
- Power BI datasets
- Power BI Premium for scale
- PBI Gateway for on-premise access
Where the Power BI-Centric Route Breaks Down
- Doesn’t extend semantics to Tableau, Excel, or Looker
- Hits performance ceilings on large datasets
- Locks you into the Microsoft ecosystem
- Limits Excel workflows
The Tableau-Centric Model
Often involves:
- Tableau Prep, Data Server
Published data sources - Hyper extracts
Where the Tableau-Centric Model Breaks Down
- Extracts can go stale, introducing governance risks
- Semantic modeling is limited
- Excel and third-party tools stay disconnected
- Poor fit for big data scale
The Looker-Centric Build
Typically built around:
- LookML
- Persistent derived tables
- Looker API integrations
Where the Looker-Centric Model Breaks Down
- LookML has a steep learning curve
- Excel integration is limited
- Complex models degrade performance
- Requires significant dev investment
The Data Warehouse-Centric Option
This relies on:
- Snowflake views, procedures
- BigQuery ML
- Databricks SQL Analytics
Where the Data Warehouse-Centric Model Breaks Down
- Semantic modeling is shallow
- Each BI tool still interprets models differently
- Governance remains fragmented
- Optimization happens too far upstream
| Approach | Built On | Bottom Line |
| Power BI-Centric Route | Power BI datasets, Power BI Premium, Power BI Gateway | Doesn’t extend to Tableau, Excel, or Looker; hits performance ceilings on large datasets; creates Microsoft ecosystem lock-in; leaves Excel workflows disconnected |
| Tableau-Centric Model | Tableau Prep, Tableau Data Server, published data sources, Hyper extracts | Extracts can go stale and create governance gaps; limited semantic modeling depth; isolates Excel and third-party tools; not built for big data scale |
| Looker-Centric Build | LookML, persistent derived tables, Looker API | Steep learning curve; limited Excel integration; complex models slow down queries; heavy developer time to build |
| Data Warehouse-Centric Option | Snowflake views and procedures, BigQuery ML, Databricks SQL Analytics | Only shallow semantic modeling; every BI tool still interprets the model differently; governance stays fragmented; optimization happens too far upstream from the BI layer |
| AtScale Universal Semantic Layer | One semantic layer above the warehouse and every BI tool | Delivers identical metrics across Power BI, Tableau, Looker, and Excel at once; centralizes business logic and governance in one place instead of rebuilding it per tool |
The Semantic Layer Solution: AtScale’s Approach
The AtScale semantic layer provides a unified foundation for scaling semantic models across Power BI, Tableau, Looker, Excel, and beyond.
One Semantic Model for Every BI Tool
- Works natively across your BI ecosystem
- Delivers consistent metrics everywhere
- Centralizes business logic in one place
- Provides a shared business glossary for cross-functional teams
As a VP of Analytics at a global financial firm said:
“After implementing AtScale, our executive dashboards finally showed the same numbers no matter which BI tool was used. The impact on trust was immediate and profound.”
Built for Enterprise-Grade Scale
AtScale keeps performance consistent across tools with:
- Intelligent aggregations based on query patterns
- Query virtualization that rewrites inefficient logic
- AI-powered query routing
- A cloud-native architecture built to scale
Governance That Works Everywhere
- Role-based access controls are applied once
- Row and column-level security is enforced across tools
- Full audit trail of all data usage
- Centralized compliance management for regulated industries
Native Excel Compatibility
AtScale integrates with Excel — no tradeoffs:
- Native PivotTable connectivity
- Business-friendly dimensions and measures
- No extracts required
- The same metric definitions across Excel and your BI tools
Real-World Success: Enterprise Implementation in Phases
A global consumer goods company scaled its semantic layer with AtScale in three phases:
Phase 1: Semantic Foundation
- Audited existing models
- Identified core business concepts
- Set naming conventions and governance workflows
Phase 2: Core Deployment
- Built-in centralized semantic model
- Connected Power BI, Tableau, Excel
- Implemented unified security controls
Phase 3: Optimization and Scale
- Expanded semantic coverage to more domains
- Tuned performance with an aggregation strategy
- Launched self-service enablement
- Defined success metrics
The results:
- 100% metric consistency across tools
- 70% less model maintenance
- 3-5x faster queries
- 40% reduction in cloud platform costs
- 90% drop in “data disagreements” during executive meetings
Best Practices for Scaling Semantic Models
Based on our experience helping enterprises implement unified semantic layers, we recommend the following best practices:
Start with High-Impact Domains
Focus first on metrics that:
- Span multiple departments
- Drive critical decisions
- Have inconsistent definitions today
- Need frequent business rule changes
Build Governance In Early
- Assign owners for semantic models
- Define workflows for building and approving metrics
- Set clear naming conventions
- Document all metrics in plain business terms
Balance Centralization and Flexibility
- Centralize enterprise-wide logic
- Let domains extend where needed
- Provide guardrails for self-service
Establish a straightforward intake process for new requirements
Track and Share Impact
- Measure query speeds before and after
- Quantify reductions in maintenance effort
- Capture executive feedback on data trust
- Track cloud spend improvements
What’s Next: The Future of Semantic Modeling
As organizations continue to mature their data strategies, several trends are shaping the future of semantic modeling at scale:
AI-Augmented Modeling
Machine learning is transforming semantic layers:
- Suggesting optimization opportunities
- Automatically routing and caching queries
- Supporting natural language interfaces
- Detecting anomalies in metric usage
Semantic Layers Powering AI
Semantic layers now play a key role in AI:
- Providing business context to large language models
- Powering consistent features for ML workflows
- Securing enterprise data for AI safely
- Accelerating generative AI development
Built-In Collaboration
Modern semantic layers support teamwork:
- Business users co-developing semantic models
- Feedback loops to improve metrics
- Cross-functional approval workflows
- Domain-specific extensions with guardrails
Unified Semantic Models Are a Strategic Advantage
Scaling semantic models across your BI stack is no longer optional. As analytics becomes a strategic driver, consistency, governance, and speed are critical.
The AtScale semantic layer provides the foundation to:
- Deliver trustworthy insights everywhere
- Improve performance at scale
- Streamline compliance and governance
- Enable collaboration between business and technical teams
The result is not just technical efficiency but strategic advantage: faster decisions, higher-quality insights, greater trust in data, and ultimately, better business outcomes.
You define your metrics, dimensions, and business rules once in a semantic layer that sits above your data warehouse, then connect each BI tool, Power BI, Tableau, Looker, and others, to that same layer instead of rebuilding the logic separately inside each one.
A tool-specific semantic model lives inside a single BI platform, like a Power BI dataset or a Tableau data source, and only that tool can use it. A universal semantic model lives outside any single tool, so Power BI, Tableau, Looker, and other platforms can all draw from the exact same definitions at the same time.
Yes. A universal semantic layer connects to multiple BI tools simultaneously, so the same governed metric definitions show up consistently whether someone opens Power BI, Tableau, or Looker, instead of each tool reporting a slightly different number.
Every new BI tool a company adopts means rebuilding the same metric logic again inside that tool. Over time, small differences creep in between versions, and teams end up debugging why two dashboards show two different numbers for the same metric instead of trusting either one.
Most enterprises start with a small set of high-impact metrics rather than migrating everything at once, build governance into that initial rollout, and expand tool by tool from there. Starting narrow and proving consistency early makes the wider rollout easier to trust.
Ready to scale semantic models across your BI ecosystem? Let’s talk about how our semantic layer can transform your enterprise analytics.
Last Updated August 13, 2026