There are six key areas for effectively consuming data for business insights: data, access, model, analyze, consume, and insights. For organizations looking to advance in each of these areas, AtScale’s Data and Analytics Maturity Model Workshop explains how teams can build their skills and knowledge.
In this blog post covering module 4 of the workshop, we’ll discuss how to move beyond data extracts to a variety of integration styles as a way for organizations to build a more flexible data pipeline and improve access to data.
What are Data Extracts?
Data extracts are typically a feature built into business intelligence (BI) tools that provide access to data from the source. For example, once Tableau is connected to a data warehouse, there’s an extract option that imports the data from the source directly into Tableau’s own data store.
Most BI tools implement a data extract or import option because it can be faster than executing queries directly against the data source. This speed is especially needed when the raw data requires complex or resource-intensive transformations to become analytics-ready.
The Problem with Data Extracts
While data extracts can be faster than direct queries, there are still challenges associated with them:
- Data extracts don’t scale: Most BI query engines aren’t designed for scalability because they usually import limited datasets that are specific to the analysis at hand. In the long run though, this creates fragmentation and complexity for data analytics across the organization.
- Data extracts get stale: The data extract isn’t a live connection to the data source, and as a result the data set becomes stale immediately. On top of that, it’s time-consuming and error-prone to regularly update these local data copies to reflect the data source.
- Data extracts create inconsistencies: Data governance and consistency become difficult to attain across the organization when every user, every BI tool, and every report uses different local data sets.
Data Integration Styles: The Alternatives to Data Extracts
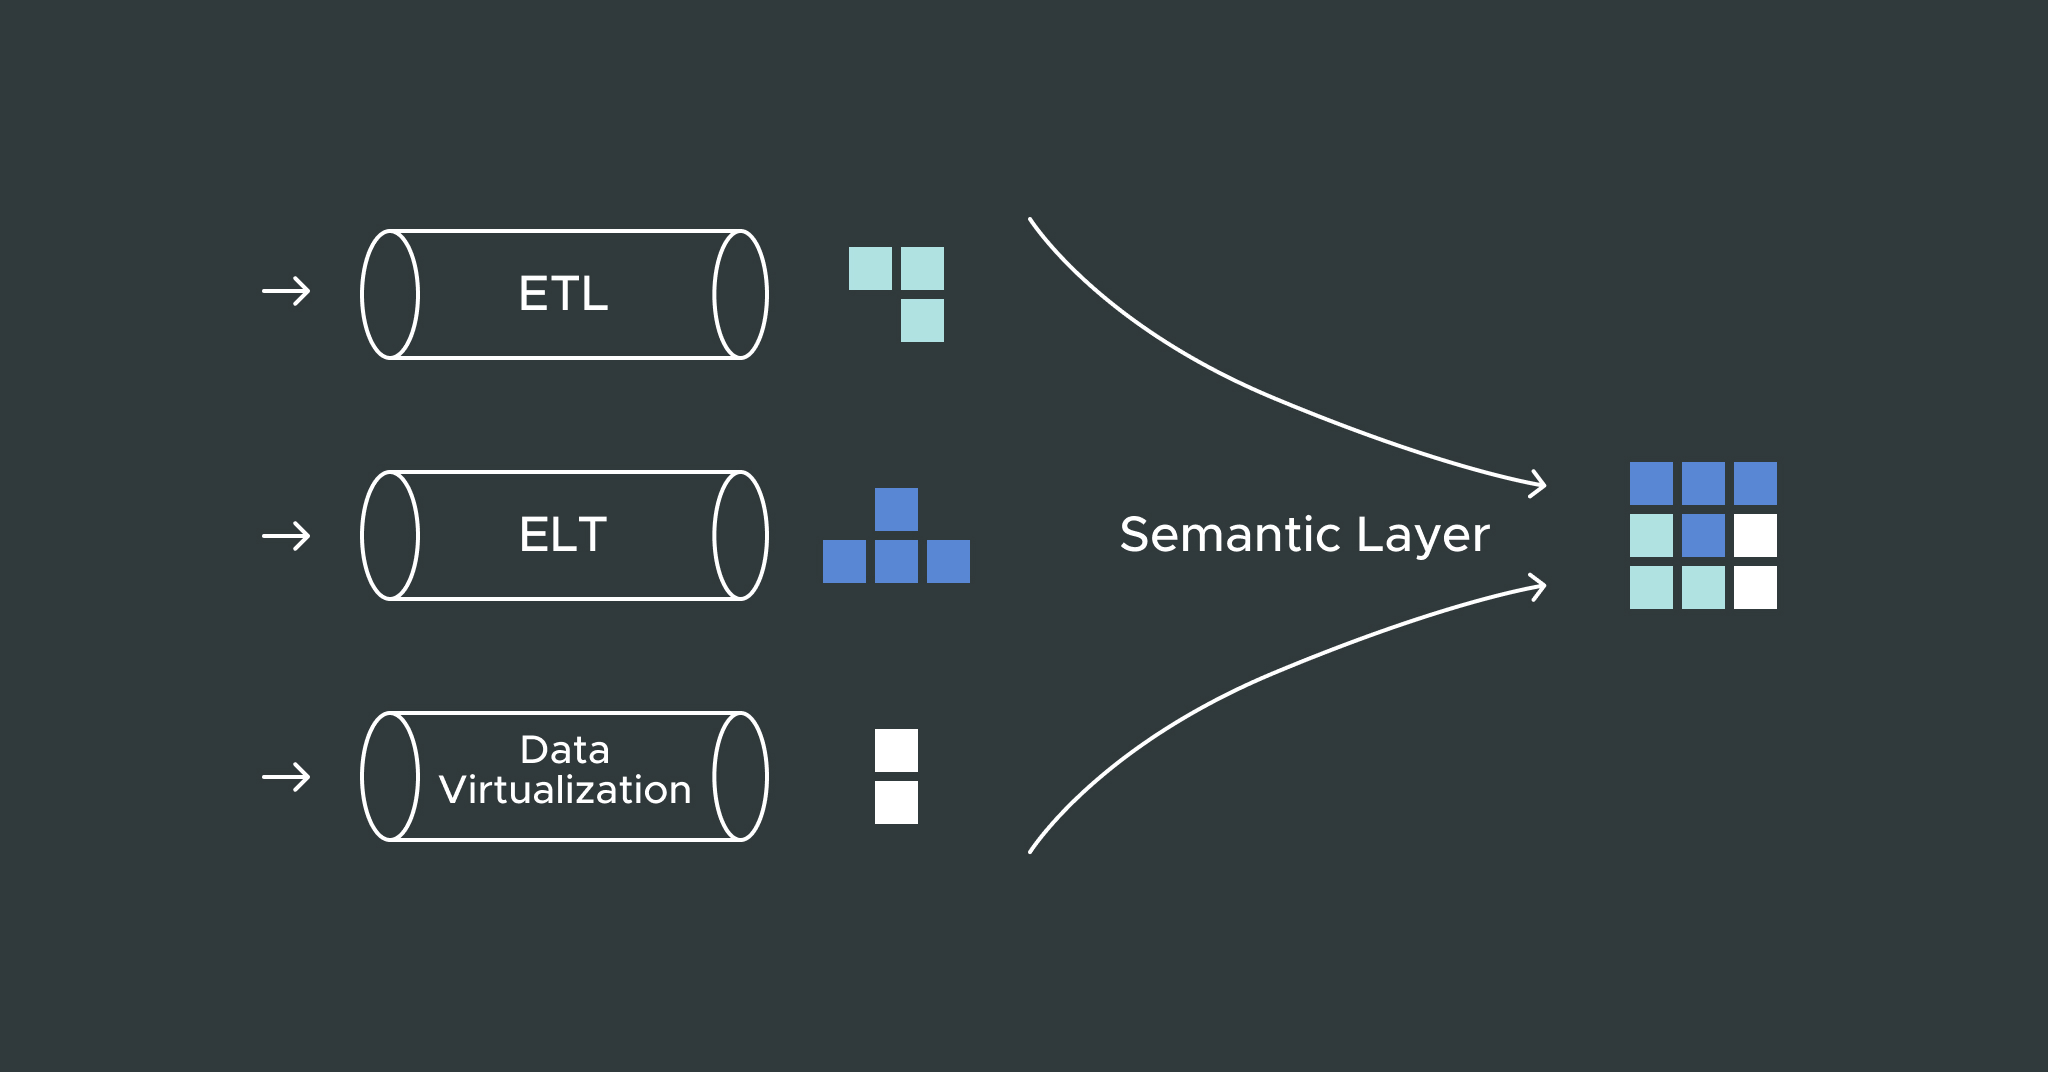
There are three primary integration styles that most organizations adopt.
1. Extract, Transform, Load
Traditional tools from companies such as Informatica and IBM use Extract, Transform, Load (ETL). This process involves extracting the data from a data lake, transforming the data into a usable format, then loading this data into a data warehouse. At this point, the analytics tools then run directly off the data warehouse.
2. Extract, Load, Transform
Extract, Load, Transform (ELT) is a more modern approach to this data movement process, but the data extraction and load happens in a single step using temporary tables. Then the transformation rules get applied as SQL or Python directly inside the data warehouse to create result tables. Once this is complete, the analytics tools can then query the result tables.
3. Data Virtualization
Using data virtualization, the data transformation process happens virtually during query time rather than physically beforehand. The transformation rules are applied as a virtual layer of tables or views that the analytics tools can consume. The virtualization layer can then make queries to the underlying data lake or data warehouse to deliver the data in near real-time without any data movement required.
Choose a Mix of Data Integration Styles
There’s no one-size-fits-all when it comes to delivering data to users. The data movement approaches (ETL/ELT) make the most sense for complex, resource-intensive data transformation that would be too slow to execute in real-time.
Data virtualization is useful for quick access, exploration and prototyping. Rather than waiting for data to move through an ETL/ELT pipeline only to discover it isn’t worth querying, users can get a quick view into the raw data using virtualization. Data virtualization is also effective for rapidly changing data, where a data pipeline might be too slow and would introduce too much staleness.
Best Practice: Leverage a Semantic Layer for Data Access
A semantic layer is a great architecture for data integration because it makes it possible to blend data from multiple sources and deliver this data to users in real time. Using business-friendly modeling, users can also consume the data without the need to understand how or where the data is stored.
In addition, governance can be applied using the semantic layer to provide secure data access to business analysts, data scientists and external users. This allows everyone in an organization to access relevant and timely data and use that data to make better business decisions.
Watch the full video module for this topic as part of our Data & Analytics Maturity Workshop Series.
SHARE
Whitepaper | Enterprise Semantics for Power BI