Exciting news hot off the press: AtScale has recently announced our support for the Feast feature store! This is part of our ongoing efforts to increase the interoperability of our platform to upstream data sources and downstream analytics tools.
AtScale AI-Link now provides native compatibility with upstream data warehouses and downstream ML platforms with easy-to-use python connectivity. This means that:
- Companies will have access to production-grade, business-vetted features that entire business units can access and reuse in a feature store (more details later);
- Data teams have a way to easily discover, reuse, and transform (as needed) features for offline training and online inference;
- Users can expedite cumbersome data preparation with intelligent aggregations in AtScale and the compute power of the data warehouse to more rapidly deploy ML pipelines and models.
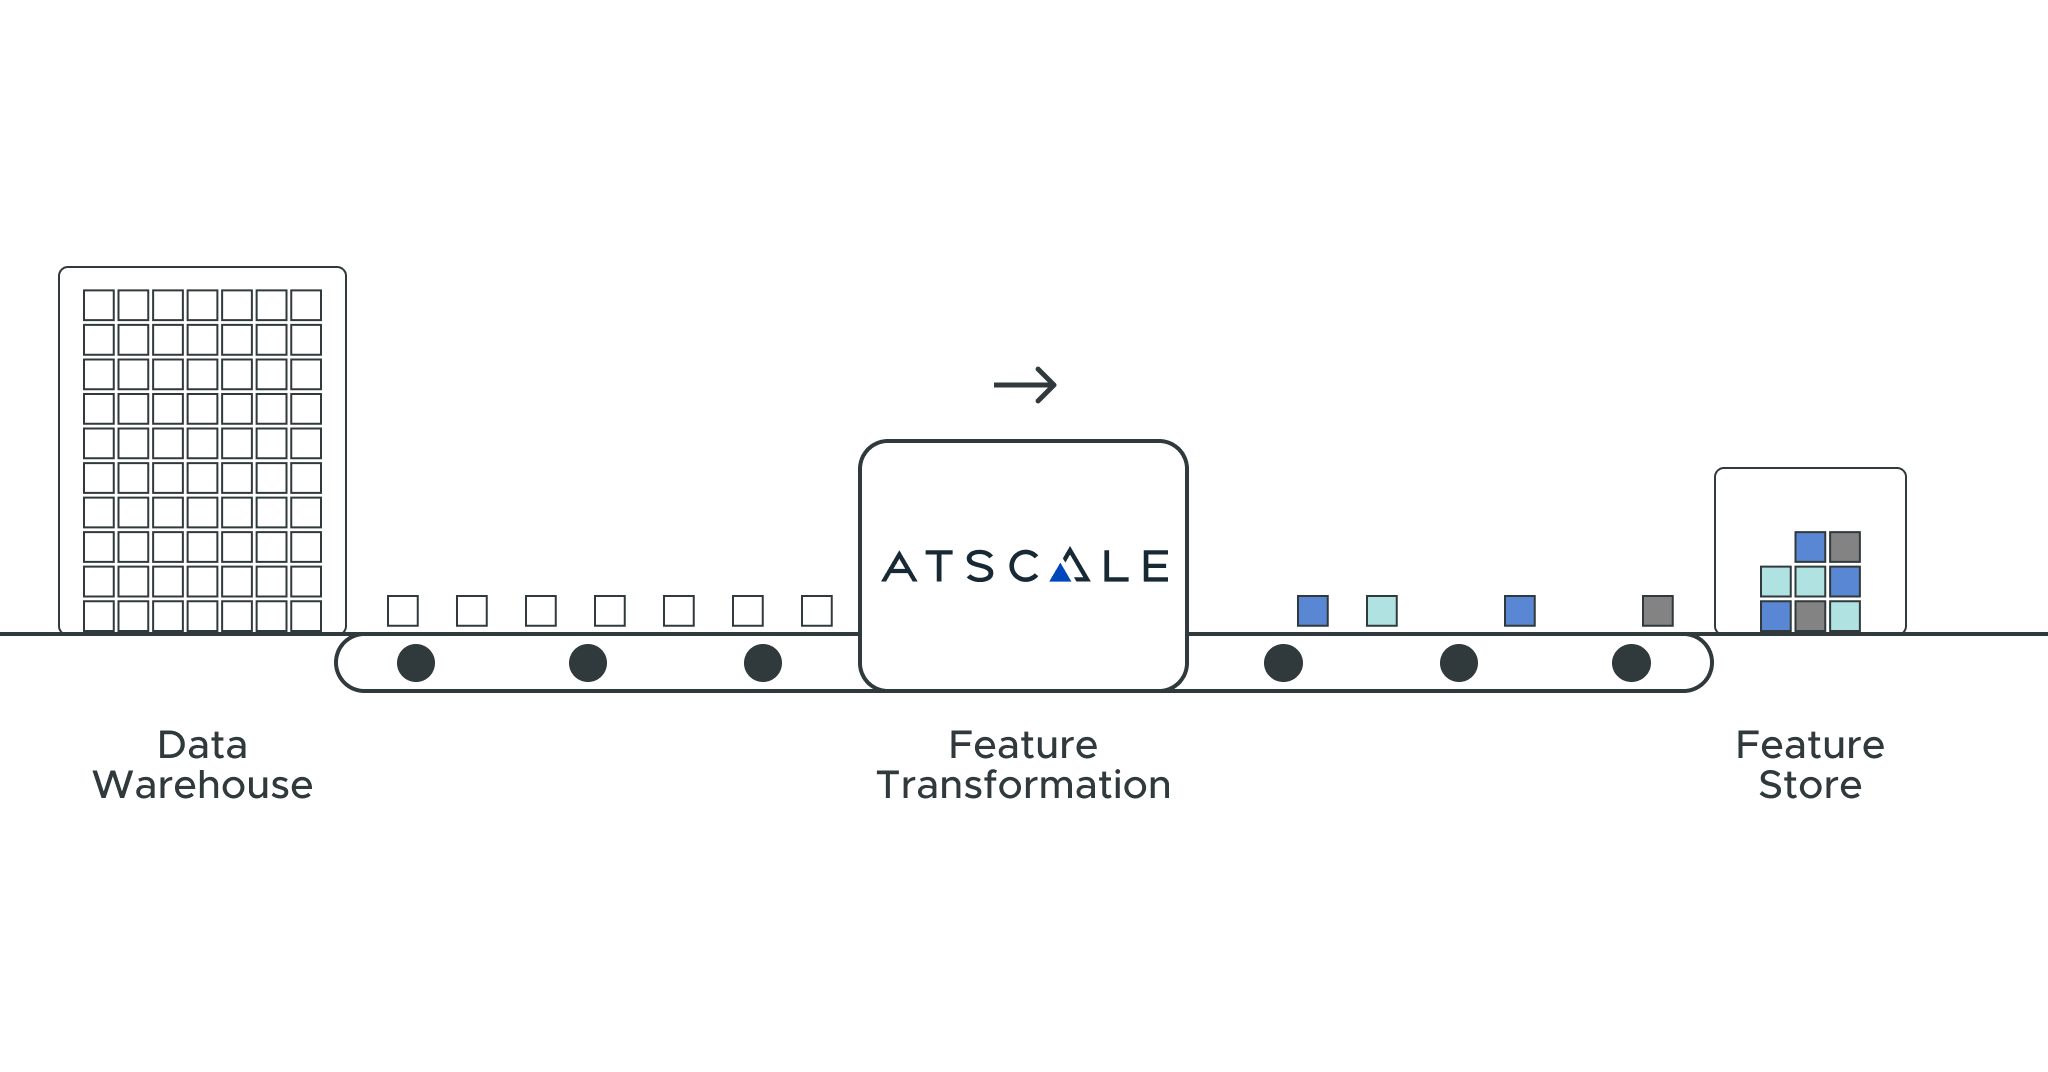
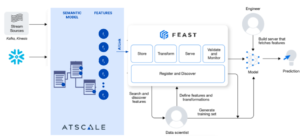
In this blog, we want to show you how all of this is going to come together to connect data to the transformations (features). We’ll then show you how to publish these features to a reusable store accessible by ML models allowing for faster, more reliable models to be deployed into production. We’ll even show how AI-Link can writeback model inferences to the semantic layer so that you can introduce BI visualizations or MLOps for model explainability.
Prerequisites
In this exercise, we’re going to demonstrate the interconnectivity between Snowflake, AtScale AI-Link, and Feast to create a time-series ML model that will help answer an age-old question: how should I forecast sales?
By going through this blog, you’ll learn how to:
- Programmatically engineer, transform, and select features using the business logic of the semantic layer and compute power of Snowflake;
- Store and serve these features from Feast to an ML model for predictions;
- Preserve or writeback those features and predictions to data models for business intelligence tool consumption.
We’ll be using the Walmart M5 data set, which includes the unit sales of various products sold in the US, organized in the form of grouped time series. While these represent historical data, we can still demonstrate the functionality of our three solutions working together to create a predictive ML model. Extra bonus points for those who compare their model predictions to actuals – we’ll talk more later about how you can do that with AtScale’s AI-Link and semantic layer.
In order to conduct this exercise, you’ll need to at minimum:
- Be comfortable working with Python and installing packages;
- Have an available Snowflake account configured (note: AI-Link will work with other data warehouse providers as well);
- Obtain the Feast Python package (building machine learning features in Snowflake with Feast)
In order to use AtScale’s AI-Link, you’ll also need to:
- Have a license or explicit permission to use the product, you can also reach out to us (details below) to get access to a limited trial lab environment;
- Have prepared data models or an initiative to create them made possible through AtScale’s semantic layer; request a demo and trial environment here!
These two are really important as they connect to the data sets and ultimately allow for the management and creation of metrics based on vetted business logic.
Setup and Configuration
Step 1 – Obtain Data
We’re going to use an m5 data set published by Walmart for a kaggle competition. It can be accessed, transformed, and queried using logic from AtScale, pushed down to the compute and storage provided by Snowflake.
Step 2 – Download AI-Link
In order to access the AtScale environment and perform necessary feature transformation for selection and storage in Feast, please reach out to zach.eslami@atscale.com with email subject ‘Request Trial for AI-Link,’ to request access to our lab environment so that you can test AI-Link for a limited trial.
After your trial period ends, or to access the full product, you’ll need to work with the AtScale team to configure your license agreement.
Step 3 – Environment setup
As mentioned above, making sure you have access to AtScale project(s), Snowflake environments, and a connection to Feast are fundamental elements to getting started.
Configuring your data models within AtScale is the next key step. Once you’ve created and selected the data model you will use, you’ll then need to initialize your AtScale connection via AI-Link. This connection will help orchestrate logic created in the semantic layer across Snowflake and Feast. AI-Link will also help facilitate feature serve and model inference writeback to the semantic layer – more on that later.
Review Data and Exploratory Data Analysis (EDA)
In this step, we’ll show a quick overview of the data set, underlying correlations, and where there is need for cleanup.
We know the m5 data set is a collection of data related to the unit sale of Walmart products in stores within 3 states; it also includes item level, department, product categories, and store details. In addition, it has explanatory variables such as price, promotions, day of the week, and special events.
At this stage, we want to explore the nature of the data so we can better understand which features are available to us, which features are important, which features need to be transformed, and what subset of cleaned data we’d want to use for model training/test.
Dimensionality and Time Series Features
In order to effectively determine which features we want to create and serve to our predictive model, we need to start by understanding the elements of the data and the connections between them.
At AtScale, we do this primarily through logical data modeling facilitated by the semantic layer while leveraging the compute power of the underlying data warehouse (in this case Snowflake). Business analysts can create data models using a common definition of features based on the data that data scientists can programmatically transform or interact with using Python. This forms a key bridge between metrics defined by the business analyst and features defined by the data science team to ensure a common understanding, computation, and value.
By using a few simple commands we can preview some of the features, hierarchies, and aggregates made available to teams within the AtScale semantic layer. These aggregates are a key tenant to the AtScale semantic layer and are very powerful for the data scientist as he or she begins this activity. AtScale optimizes aggregations so the data scientist can programmatically append data models and use the data warehouse engine for optimal query performance, even when working with datasets typically too large to load into a dataframe.
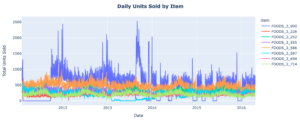
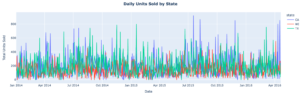
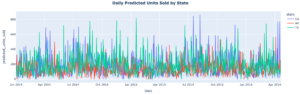
We can review features, their descriptions, and the dimensionality of our data set to see if there are any preliminary correlations we can glean between variables. AI-Link’s flexibility allows us to call any Python library to make it super easy to understand our data set and create exploratory graphs to further explore data trends. Here we constructed a time series graph for top units sold:
Note: Because AI-Link allows us to generate a Pandas dataframe, that means we are natively compatible with all Python libraries (Matplotlib, NumPy, SciPy, etc.).
From this graph, we can understand a few things about our data:
- There are pretty consistent ebbs and flows throughout the year across time, states, and items. The end of year during the holiday season for example always causes a spike in demand and resultant units sold before stabilizing at the start of the next year.
- Generally speaking, the data are much more normalized and consistent from the start of 2014 moving forward. This means there are likely less outliers and thus a better indication of normal sales behavior.
We can then quickly transform our data set to a subset and filter based on our observations above for model training. We are also able to generate our desired set of features (units sold) with defined hierarchy (based on date) and grouping (based on state, category of product, and product itself).
Data and Feature Transformations
At this point, we’ve got a nice set of data to use for training. We’ll want to then perform key actions to make sure everything is ready for ML training.
One Hot Encoding – converting any categorical data variables into binary vectors to be easily consumed by an ML model.
project.create_one_hot_encoded_feature('category', 'item_hierarchy')
Min/Max Feature Scaling – to normalize our features to the same binary scale. You can do this by creating a new feature based on existing categorical variables and your defined min/max (in this case total units sold). This is important to consider if you have a team working with different slices of a data set as team members may get different minimums and maximums of the data upon which they’re basing their analysis, models, etc. By normalizing your features within AtScale, we can push down a singular view of the data to the data warehouse.
project.create_minmax_scaled_feature('total_units_sold',
'scaled_units_sold', minimum, maximum, description=description)
We can also use MDX to programmatically create new calculated measures that we may find useful after taking a dive into our data. For example, a rolling 30 day average.
Here you can see in both cases, we have the requisite transformation functions needed to perform this task.
Feature Publication to Feast
At this point we have our defined data set and features that we think matter most to model development for this kind of time series model. All of the data still resides in Snowflake, and business/feature logic is in the AtScale project. You can imagine, after going through all of this work, wanting to create standards for your team to reuse for similar modeling needs. This is where a feature store comes into the mix. Feast is great for this as it is an open source, enterprise grade store that allows for offline serving of features for training and online serving for inference through low latency, high throughput connections.
Connecting to Feast
With AI-Link we can easily query and publish our features to a desired location within our Feast repository. After we determine which features matter most to us (prediction_features), we can use AI-Link to create a Feast project (“Walmart“) that will maintain the feature definitions, hierarchies, and dimensions:
project.create_feast_repo(project_name="walmart",
                         features = prediction_features,
                        entities=['item', 'state'],
                        timestamp='date',
                        view_name='walmart_ts',
                         ttl=datetime.timedelta(weeks=0),
                        force_rewrite=True)
Then it’s as simple as importing the definitions and applying them to the Feast repository:
import importlib
from feast import Feature, ValueType, FeatureStore
import walmart
import walmart_starter
from walmart_starter import walmart_ts_fs_entity_df
from walmart import walmart_ts, state_entity, item_entity
You can then serve these features from Feast to start training your model. In this example, we’re going to use XGBoost to help us create a predictive model using an XGBoost algorithm to produce inferences based on materialized data.
Once you have your preliminary model, you’ll then want to start running it to assess performance. Given that we’re creating a time series model, we have an inherent dependency on the newest version of data to make accurate predictions.
Model Inference (Predictions) and Writeback
Materialize and Split Train-Test
We’ll want to materialize data for our training and test sets from the larger dataset based on our considerations noted above (e.g. only use data from 2014 and beyond). Luckily we can use AtScale’s predefined aggregates and Snowflake’s compute power to make this super easy and fast. Then we’ll train our model and run some quick visualizations to see how our predictions did vs. actuals:
 Trend lines look pretty similar, but there is still some slight variance that we can address:
Mean absolute error = 6.71
Mean squared error = 129.35
Median absolute error = 3.95
Explain variance score = 0.97
R2 score = 0.97
So we can go back into AtScale, select new features based on our findings from initial model tests, transform them (encode + scale as before), and ultimately update our repository in Feast with these new features. As we retrain our model, we can see that performance has improved as a result:
Mean absolute error = 3.17
Mean squared error = 74.52
Median absolute error = 1.66
Explain variance score = 0.98
R2 score = 0.98
At this point, we’ve now collected a set of predictions from our model, but we need to analyze them to understand if our model needs to be re-trained. We also need to determine if our forecasting model can help tell us something about how to prioritize sales, supply chain, etc. based on time of year.
We can now writeback these predictions to Feast to store as a new feature and append our predictions as a data frame back to our existing data model within AtScale.
import pandas as pd
#test set
rows = []
ent_df = project.get_data(features=['item', 'state'], filter_in={'item':top_items_list}).to_dict('index')
for row in ent_df.values():
   rows.append(row)
print('Entity Rows: ')
display(rows[:5])

#latest data for test set
vectors = walmart_ts_fs.get_online_features(
   entity_rows=rows,
   features=[f'walmart_ts:{feat.name}' for feat in walmart_ts.features]).to_dict()
vector_df = pd.DataFrame().from_dict(vectors)

y_column = 'total_units_sold'
X, y = (vector_df.iloc[:,
                     ~vector_df.columns.isin([y_column, 'item', 'state', 'category'])],
       vector_df.iloc[:,
                      vector_df.columns.isin([y_column])])
display(X.iloc[:5,:])
y.head()
We can materialize the latest data into our dataframe as well, ensuring that the data model we append is referencing the most up to date version of the data.
This allows us to:
- Easily query and reference features we selected in AtScale from our Feast repository for reference and reuse in the future;
- Store predictions as a new feature view within Feast, providing additional context to correlate predictions to the features used to further the modeling workflow and help prevent future training/serving skew;
project.add_feature_view(view_name="predictions",
                        project_name='walmart',
                        entities=['item', 'state'],
                        timestamp='date',
                        features=['sum_predicted_units_sold',
                                  'total_units_sold',
                                  'total_units_sold_28_day_max'],
                         ttl=datetime.timedelta(weeks=0),)
- Programmatically writeback their predictions to append data models used for business intelligence platforms; this means that business analysts are now able to capture the full spectrum of analytics from descriptive to predictive so that machine learning can more effectively be used to influence business strategy decisions.
These three platforms bring together a powerful partnership; it allows data scientists to more expeditiously re-train and optimize model performance, minimize re-work for similar use cases in the future, and helps foster collaboration with business analysts to create a core narrative around data/model findings to guide executive decision makers – thereby bridging the gap between business intelligence and artificial intelligence.
Scaling ML Analytics with AtScale and Feast
Thanks for reading along, we hope this was a useful guide for you to leverage tools already available to your organization to manage your data, features, and core business logic for creating a time series ML model. This process will eliminate duplicative work, allow for faster productionized AI, and ultimately help data scientists in core activities related to ML model development.
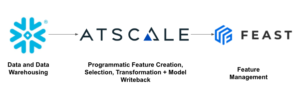
Here’s an easy diagram to remember how all our pieces come together to generate business-ready ML models:
This is the first of many blogs! If you have thoughts, comments, questions, or ideas, we’d love to hear from you.
If you would like access to a trial of AI-Link, or have any questions, please feel free to reach out to us directly: zach.eslami@atscale.com.
Happy modeling!
SHARE
Whitepaper | Enterprise Semantics for Power BI