Despite having a billion users, Excel is not always thought of as a business intelligence (BI) tool. Yet Excel remains by far the predominant BI consumption platform in enterprise data because its formulas and functions make it a powerful tool for last-mile analysis.
With cloud computing and big data dominating the enterprise BI landscape, Excel users face several challenges adapting Excel to modern data infrastructure.
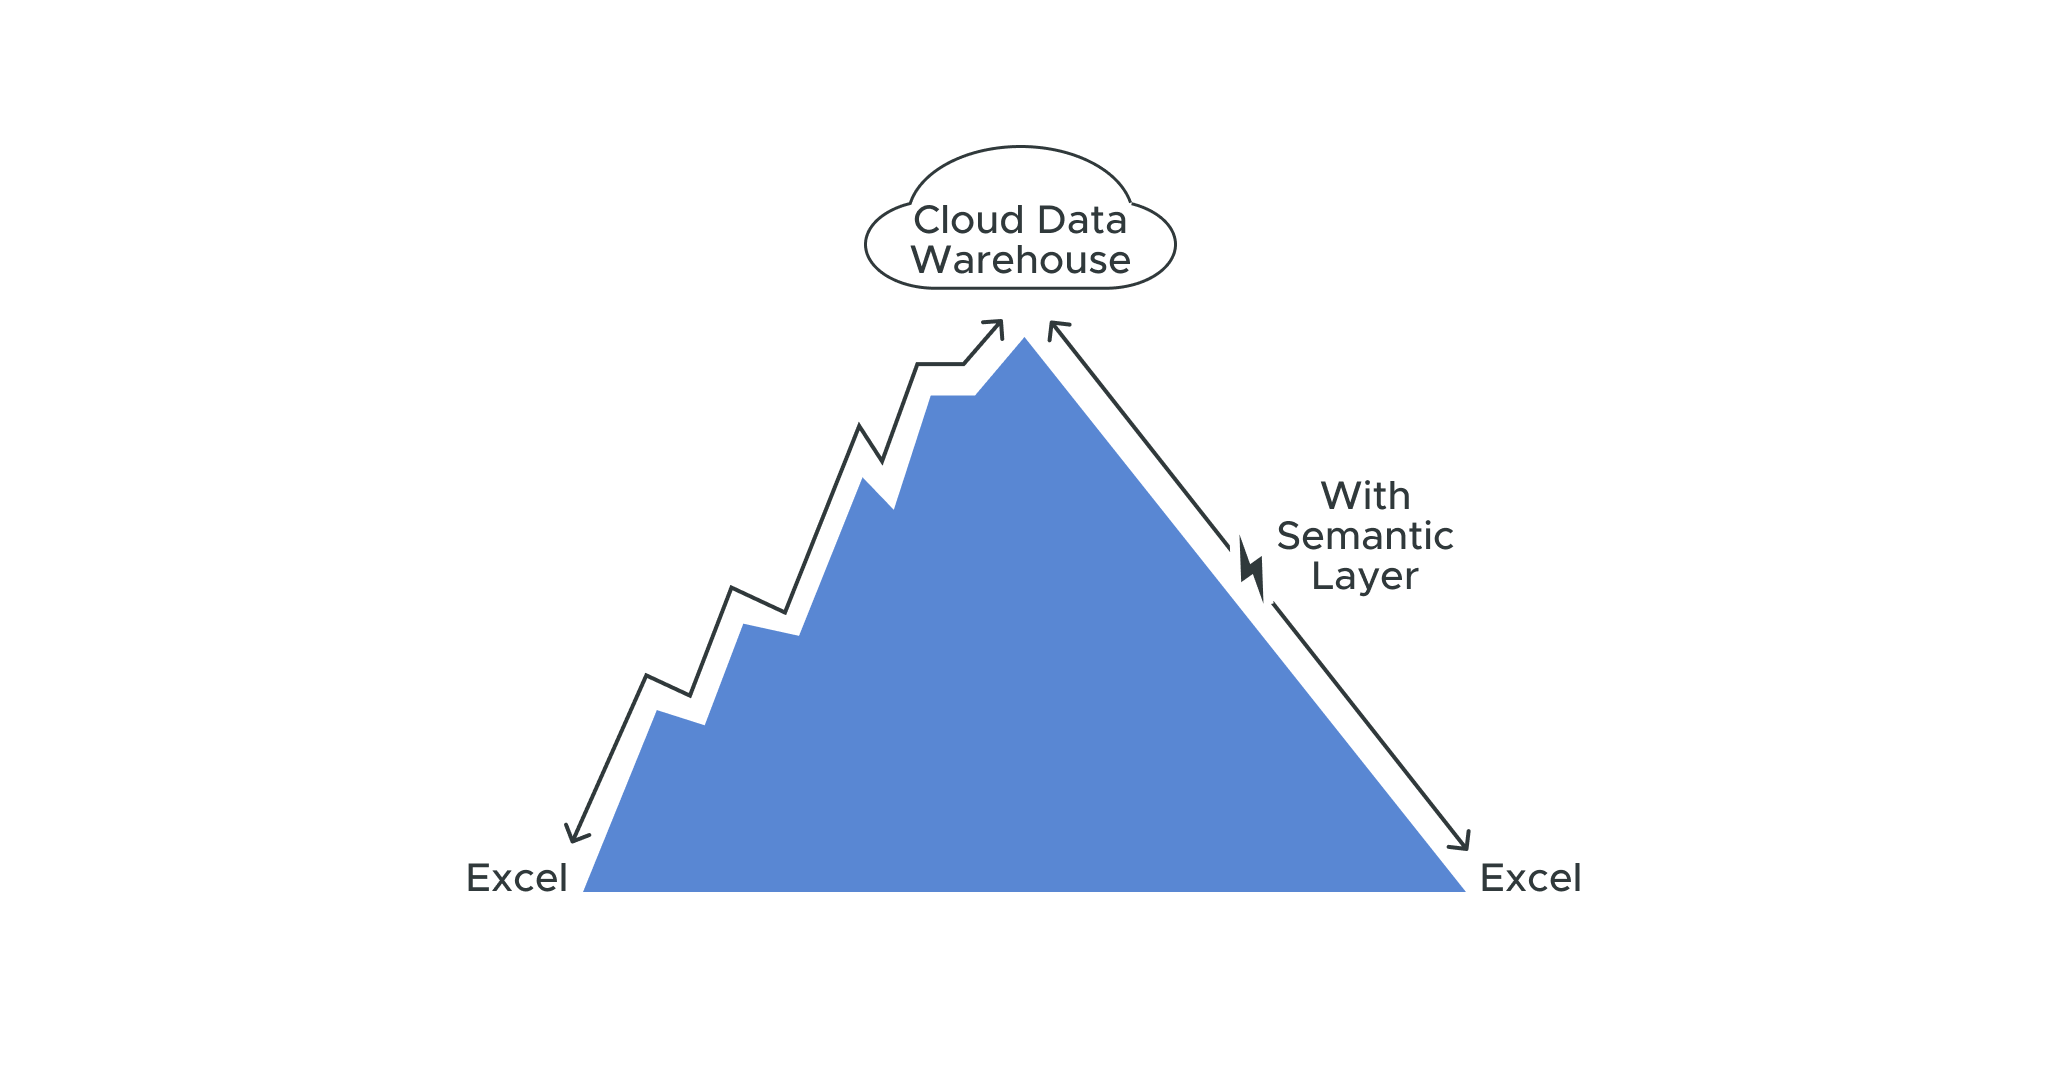
For one, Excel was built for proximity to data sources. It can connect directly to cloud data platforms, but this requires a cloud data management strategy aimed at optimizing queries and taking full advantage of your data storage layer. Furthermore, ad hoc approaches to Excel cloud connections mean there is no layer for defining consistent metrics for the business, making it difficult to share models across departments.
In this blog post, we’ll cover the various approaches to using Excel to connect with cloud data warehouses. We’ll also discuss some areas of recent Excel innovation and show how a semantic layer can deliver high-speed analytics at scale without the need for data extracts, data movement, or client-side drivers.
What are the biggest challenges facing enterprise Excel users in 2022?
Analysts and executives continue to rely on Excel for its flexibility for ad hoc analysis, data inspection, and dashboard capabilities. The challenge, however, is bringing the power of Excel to massive data sets in a cloud-native data architecture.
One approach is to copy-and-paste data sets directly, but that requires a manual update when the underlying data changes. It can also result in excess data issues, such as when Public Health England failed to track 16,000 unreported COVID-19 cases due to Excel’s row limitation violation.
Excel connects directly to the cloud storage layer using Excel’s native ODBC driver with Microsoft Query, allowing you to query data sets in Snowflake, Databricks, AWS, Google Cloud, and Microsoft Azure. But, again, this requires careful management. Row limitations become a challenge when you’re working with multiple thousands of rows. And depending on the setup, this may still rely on extracts of data from primary sources.
Another area of concern is sophisticated functions that weigh heavily on compute. For example, cross joins, by default, make all possible Cartesian products of rows from each table. This represents a huge computation which is more than is necessary for most use cases, and it can have a negative impact on computing performance and limit what you can do.
Furthermore, setting up Excel directly often happens at the business unit level. A finance department and sales department might build their own ways of connecting to databases with custom-built models. Without a mechanism that gives a universal source of truth, there is no common business language for concepts like “revenue.”
Some considerations around setting Excel up for live cloud data environments
Many organizations build an in-house OLAP/SSAS solution to allow Excel to work on cloud data. This may work in the short term, but it creates several issues that hamper collaboration and time-to-insight:
- In-house solutions require governance and maintenance to optimize performance.
- These approaches often disconnect workbooks from live data. Complex transformations in Excel – such as calculating new metrics or refining dimensions – need to be reproduced for new data sets. What’s more, data needs to be refreshed, and new data elements may break existing models.
- For larger enterprises, different business lines often develop solutions independently. This may work for engineers and analysts, but it makes it difficult to scale self-service analytics to non-technical users. Users are unable to share data across segments; there is no universal source of truth and no reliable way to access data from different consumption tools.
- If performance issues arise, engineers and analysts may develop ad hoc solutions such as querying a relevant subset of data or pre-aggregating to some level. They may end up calculating new metrics, cleaning up dimensions, and summarizing data. But they’ll have no way to add metrics and data definitions to provide the consistency users need to consume those metrics within the tool of their choice.
- Blended data sources can also be an issue. Due to the complexity of raw data structures, using functions like Excel PivotTables may require extracting or pre-processing data from disparate sources.
How a semantic layer enhances Excel performance and collaboration
AtScale’s semantic layer provides a simple and performant way to query live data sets within Excel. It starts with a well-designed model with pre-blended data sources, clearly defined business metrics, and hierarchically structured analysis dimensions. The semantic layer exposes this model structure to PivotTables. Excel sends queries to AtScale using a dimensional query language (MDX), and AtScale translates that inbound MDX into the appropriate SQL dialect for the cloud data platform.
Inside the cloud data platform, AtScale intelligently creates data aggregates based on its knowledge of the data structure and user behavior, enabling it to accelerate query performance. This approach is similar to SSAS cubes, but it does not rely on extracts or large cube structures.
This semantic layer is deeply integrated with Excel’s advanced analytic functions, including PivotTables, slicers, and cell definitions, and can work with cell-level CUBE functions for embedding dimensional queries.
What this means is consumers can use Excel to directly query live data sets while being shielded from the complexities of raw data and dimensional models.
AtScale updates over the past year
Given the importance of Excel within the BI world, AtScale has released several features for boosting Excel performance while querying live cloud data over the past two years.
Support for dimensional level alias
End users accessing calculated measures in some instances have to click through each level of the hierarchy to find what they’re interested in. As a result, users may end up computing subtotals that they don’t need or require.
For example, if a user wants to compare sales between months, Excel by default would calculate the yearly and quarterly totals in addition to the monthly totals. The user would have to click through this hierarchy to find the monthly totals. AtScale allows bypassing the requirement for including the hierarchy using the “Level Alias” attribute.
Cube function support
Cube functions are useful when a PivotTable is overkill. For example, if you need specific cell values to perform local calculations, cube functions allow you to query those cells (or a range of cells). AtScale has added support for cube functions including CUBEMEMBER, CUBESET, CUBEVALUE, and CUBERANKEDMEMBER.
AtScale previously added support for multi-level Top-N filtering in 2020.5.0, released in January 2021.
Additionally, AtScale has a number of performance-related settings aimed at enhancing Excel performance, such as configurations for high-dimension cross join queries.
You can learn about these settings and take a deeper dive into boosting high-speed analytics on Excel in our recent webinar, Excel Tips, Tricks, and Recent Innovations. Check out our blog to learn How a Semantic Layer Turns Excel into a Sophisticated BI Platform.
SHARE
2026 State of the Semantic Layer