What’s The Deal With Excel?
Excel is the most predominant BI tool in the enterprise because of its versatility, ease of use, and range of capabilities. It is the tool of choice for almost a billion analysts worldwide. However, whenever I ask someone in IT what BI tools their analysts use, the usual response is a pick-n-mix from Tableau, PowerBI, Looker, Qlik, or Microstrategy.
I almost always have to follow up with “What about Excel?” The usual response is “Oh, everyone uses Excel” or “Everything ends up in Excel.” Ask a few more questions, and it usually becomes clear that they face several challenges connecting Excel users with their enterprise data stored in modern cloud platforms. Why is that?
While Excel can connect directly to cloud data platforms, it requires careful management. Row limitations become a challenge when working with thousands of rows. Depending on the setup, you may still rely on data extracts, which can become a data governance nightmare and lead to analysts running the business on a limited view of data.
Another area of concern is sophisticated functions that weigh heavily on compute. For example, cross joins represent a huge computation, more than is necessary for most use cases, and it can negatively impact compute performance and limit what you can do.

IT explains how Excel users get access to data in the cloud.
Finally, setting up Excel directly often happens at the business unit level. A finance department and sales department might build their own ways of connecting to databases with custom-built models. Without a mechanism that gives a consistent and compliant view of data, there is no standard business language for concepts like “revenue,” and the answer you get depends on what Excel sheet you are using or what data extract you are analyzing.
So it’s no wonder nobody is quick or keen to highlight their use of Excel when asked about their BI landscape. But what if there was a better approach for IT and the business?
Semantic Lakehouse for Excel
A “Semantic Lakehouse” is an architecture pattern that has quickly become popular with enterprises looking to democratize their Data Intelligence Platform. Decision makers often leverage various business intelligence tools, including Excel, and providing consistent, governed, and performant access to their enterprise data can be challenging. A Semantic Lakehouse solves this problem.
By adding a Semantic Layer platform on top of a Data Lakehouse, you can eliminate the Data Warehouse piece of the stack altogether because the Semantic Lakehouse platform:
- Delivers “speed of thought queries” on the data lakehouse using data virtualization and automated query performance tuning.
- Delivers a business-friendly semantic layer that replaces the proprietary semantic views embedded inside each BI tool and allows business users to ask questions directly against the Delta Lake without needing to write SQL queries or understanding how to use Databricks.
- Delivers data governance and security at query time.
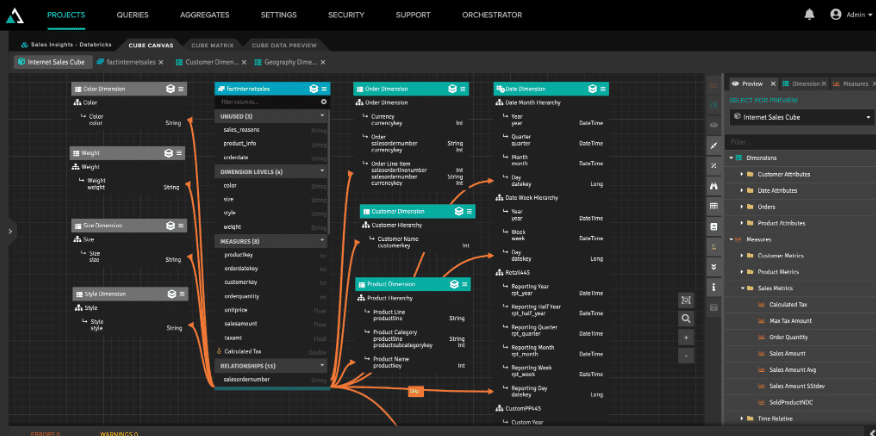
AtScale’s Semantic Layer provides a simple and effective way for Excel users to query the Delta Lake directly with Databricks SQL. It starts with a well-designed model, clearly defined business metrics, and hierarchically structured analysis dimensions. This means there are measures, dimensions, hierarchies, and business-friendly constructs that eliminate the need for data consumers to understand SQL or have any advanced data engineering skills.
This logical data model relies on data virtualization to give data consumers a logical view of the data rather than physical access. Through data virtualization, data consumers can have access to data that’s more up-to-date and has undergone additional processing to improve its usefulness without any data movement.
What Does This Mean For The Excel User?
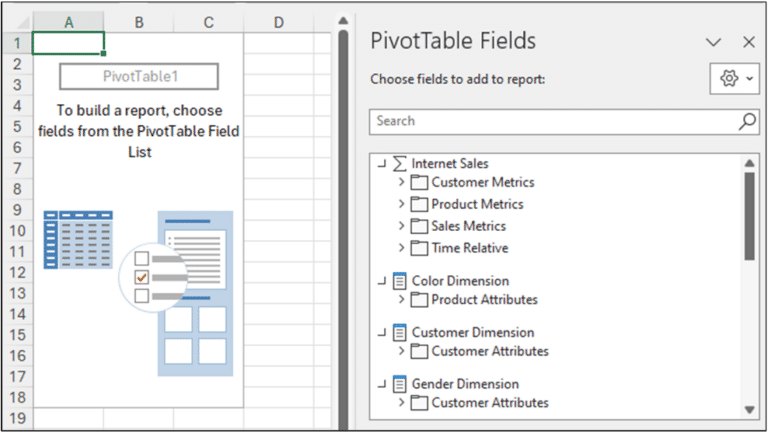
AtScale is deeply integrated with Excel’s advanced analytic functions, including PivotTables, slicers, and cell definitions, and works with cell-level CUBE functions for embedding dimensional queries. The semantic layer appears as a SQL Server Analysis Services (SSAS) database to Microsoft Excel (i.e., the AtScale data model emulates an SSAS “cube” to Excel but there is no cube and all the data lives in Databricks). Excel sends queries to AtScale using a dimensional query language (MDX), and AtScale translates that inbound MDX into the appropriate SQL dialect for Databricks to run using its elastic compute.
With AtScale, analysts can use Excel to directly query live data sets in the Delta Lake using DB SQL all while being shielded from the complexities of raw data, dimensional models, complex SQL, or having to settle for stale subsets of data aggregated together in rigid SSAS cubes.
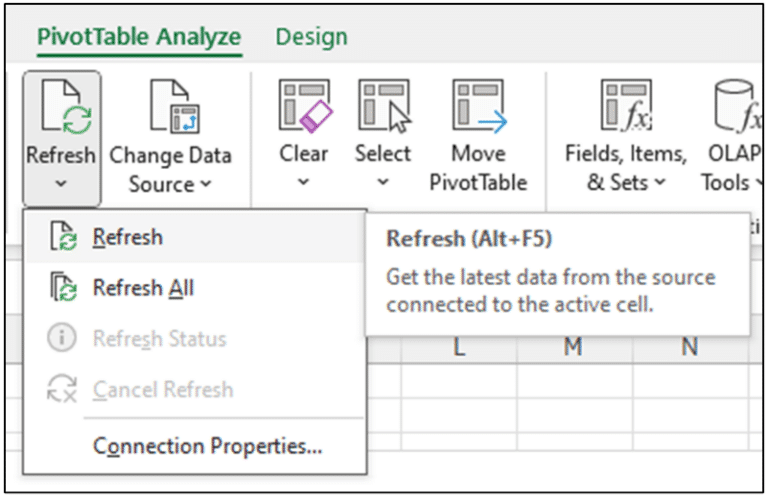
When data needs to be refreshed, users can click on Excel’s Refresh menu option to refresh cloud data automatically. By leveraging Excel’s CUBE functions linked to live cloud data through AtScale, users can update Excel-based models without the typical offline data prep and copy-pasting into their live models. This simplifies the process of updating models and reduces the chance of mistakes.
Excel users can now have a guided experience with their enterprise data and can perform ad-hoc analytics without having to involve IT. As new data is made available in the Lakehouse, analysts will be able to make use of it to drive decisions. If you are looking to learn how to use Excel PivotTables to forecast data with real-time data without any data extraction, here are links to a great series of blog posts by Dave Langer on the AtScale website:
Part 1 – The Scenario
Part 2 – Time Series Analysis
Part 3 – Distribution Analysis
Part 4 – Categorical Analysis
Part 5 – Forecasting
What Does This Mean For The IT Organization?
First, your Excel users will now get live and governed access to your enterprise data platform through a centrally managed semantic layer. There are no more hodge-podge solutions, or Shadow IT approaches. AtScale is essentially using Databricks for your Excel users.
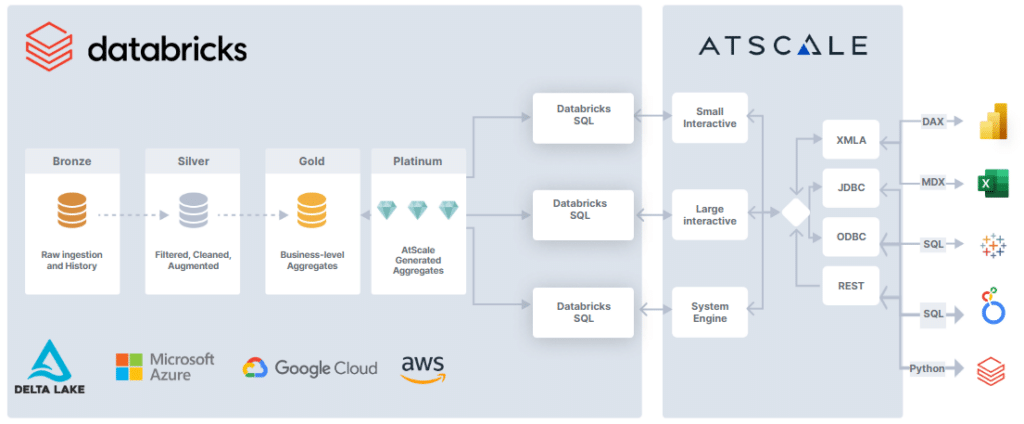
To ensure these users have a low latency experience, AtScale creates data aggregates based on its knowledge of the data structure and user query patterns, enabling it to accelerate query performance by intelligently leveraging DB SQL. AtScale fully manages these aggregates and will be updated/merged/deleted as user query patterns change or new data is made available in the base tables. Our customers call these aggregate tables the AI-generated “Platinum Layer” while others view it as a way to automate the creation of the Gold Layer, but at the end of the day they are normal delta tables in your Delta Lake.
We call this “Autonomous Data Engineering” and it drastically accelerates Data Engineering team’s ability to iterate on Data Products. A Fortune 50 Financial Services Company leveraged AtScale to reduce turnaround time for the views to deliver high-performance dashboards from three to four months to one month, which saved them ~ 2,560 labor hours. Without AtScale they had a small army of Data Engineers spending too much time and effort finding, getting access to and joining data to build our their aggregate/view layer.
There are no practical limitations on the size of the data on which AtScale semantic models are built. This means users can leverage Excel to directly analyze the largest data sets in the Databricks Delta Lake. Check out our recent “AtScale+ DBSQL” benchmark report on 100GB, 1TB and 10TB of data to see the full scale and performance benefit of the combined offering.
Excel will continue to be the world’s most popular data and analytics platform for the foreseeable future. Organizations moving analytical workloads to the cloud would be remiss to not consider how Excel works with their cloud data. AtScale enables organizations to provide self-service data access that lets Excel users maintain their analytics agility while creating more scalable analytics programs on the Databricks Data Intelligence Platform.
SHARE
Whitepaper | Enterprise Semantics for Power BI