July 18, 2019
Interactive, Large Volume AI/ML Queries At Scale And Without Data Movement for Self-Service Analytics Empowerment
AtScale can help BI users and data scientists operate more efficiently by getting more from their semantic layer solution to support sophisticated analyses like predictions, forecasting, and analyzing pattern anomalies as examples.
In this post, we’ll discuss how to leverage calculated measures to execute sophisticated time series analysis. Time series analysis is one of the most commonly used business analysis techniques. And, by using AtScale’s semantic layer solution, analysts can work with live connections to massive data sets while implementing time-based calculations with standardized, time-relative analytics.
By leveraging the principles of dimensional modeling and a highly flexible expression builder, users can quickly and reliably implement calculated measures incorporating time-relative expressions for more efficient and effective use of their data.
Using Calculated Measures in AtScale to Get More Out of Your Data
To demonstrate the power of calculated measures, we will walk through two different common scenarios: creating an average sales per order and a rolling period calculated measure in an AtScale model. In both these examples, we will showcase useful features you have available while working with calculated measures in AtScale.
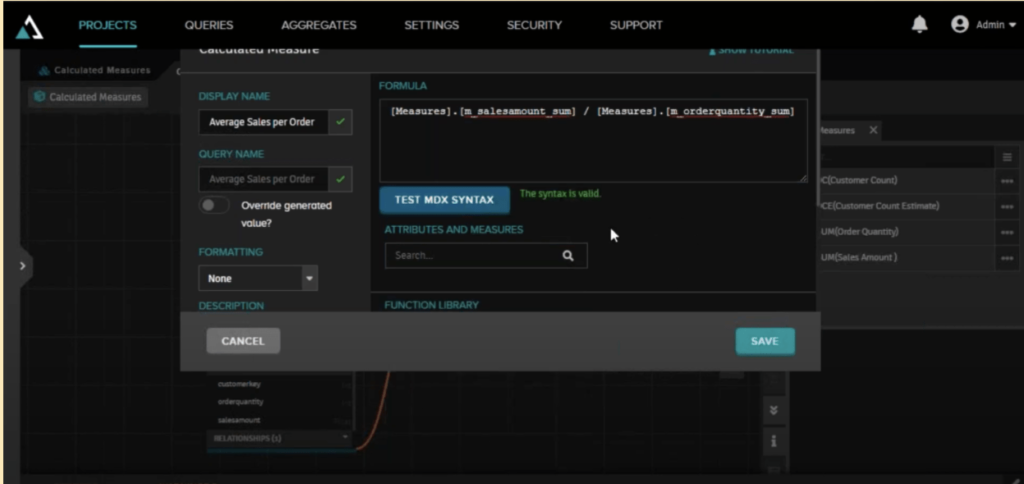
First, let’s create a measure that calculates the Average Sales per Order by dividing the sum of Sales Amount by the sum of Order Quantity. We are able to express this calculation using an MDX formula in the “Create Calculated Measures” window in AtScale Design Center.
Expressing a calculated measure using an MDX gives the user more customizability and power when creating measures, from simple ratios and formulas to complex time windowing calculations.
For those who don’t write MDX, there’s no need to worry. With AtScale, you don’t need to be an MDX guru to create calculated measures. Instead, by using the measures/attribute search bar, along with the function search bar, you can create calculated measures with ease. The “Test MDX Syntax” button is also very helpful to check the MDX formula’s syntax, ensuring you’re working the way you should.
Below we can see our first calculated measure (Average Sales per Order) formula in the calculated measure creation window:

Once the calculated measure has been created, you can then save the measure and publish the model so all data teams (BI and Data Science) can access the semantic model in their analytical tool of choice. With the calculated measure published to the AtScale semantic model, the user is able to access the calculated measure and create a time series analysis through their BI tool of choice.
Ratio Calculated Measure
Using our first calculated measure “Average Sales per Order”, we are next able to visualize the measure through time and roll up or down using our model’s Date hierarchy. Then, by applying our AtScale semantic model, we can create a bar chart in Tableau and drill down into the Date dimension for greater detail like so:
Rolling Period Calculated Measure
For the second scenario, let’s define a rolling period calculated measure. This measure will calculate the mean distinct customer count for the previous three periods. We then create our calculated measure using the same steps as the first scenario, using a formula that creates a rolling period calculated measure, which is shown below.
After creating the rolling period MDX formula, we publish the semantic model, andare then able to access the new measure (“Customer Count – Rolling Period”) in our BI tool of choice. Now, we are able to drill through the average of the last 3 periods along our model’s Date hierarchy.
Summary:
In this blog post, we discussed:
- How to create a new calculated measure in AtScale.
- How to combine calculated measures and date hierarchies for time series analysis.
- How to use AtScale’s MDX formula editor and helpers to create rich expressions.
- How to publish an AtScale model and query the semantic model in Tableau.


Power BI/Fabric Benchmarks