September 30, 2021
How to Connect AtScale to Excel to Directly Analyze Large Cloud Data Sets
In the previous blog in this series on Excel + AtScale, we demonstrated how to connect Amazon Redshift to an Excel Pivot-Table. AtScale is able to leverage Microsoft’s MultiDimensional eXpressions (MDX) protocol to natively deliver a dimensional analysis experience to Excel users. Microsoft introduced MDX in 1997 as a front end (i.e. data consumer side) query language to communicate to SQL Services Analysis Services (SSAS) OLAP models.
In this blog, we will look at how MDX is a great solution for answering complex business problems without complex SQL queries. Further, we will see how AtScale helps businesses reduce query complexity by taking a peek behind the scenes with AtScale’s query translation feature.
What is MDX and How does it work?
MultiDimensional Expressions (i.e. MDX) query language was invented by a group of engineers including Mosha Pasumansky, one of the architects for SSAS. MDX was first implemented with the release of OLAP Services 7.0 in the late ’90s. Unlike SQL, a two-dimensional query language, MDX is used for the querying of multidimensional data (three-dimensional models/ OLAP models), by using measures, dimensions, hierarchies, and attributes. Although there are similarities between these languages by using similar clauses for their query statements- SELECT, FROM, and WHERE, they are far from being the same.
MDX in Excel
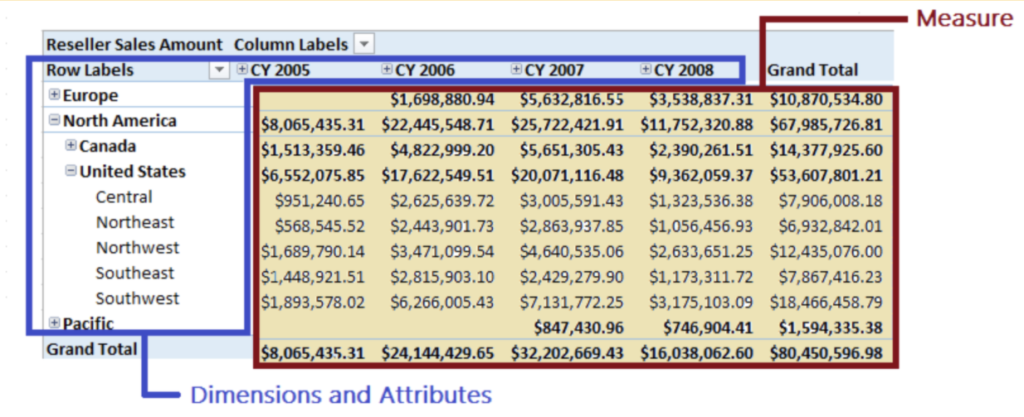
In this Excel PivotTable, we can see some of the elements needed for an MDX query (Dimensions, Attributes, and Measures), three key components in any MDX query.

AtScale allows the BI user to define these measures, attributes, and dimensions through the CUBE CANVAS, once defined these will show up in the PivotTable Fields section of the Excel workbook, like so. This helps the BI user find these measures and dimensions from an organized semantic model, which AtScale provides to the users.
For an in-depth overview of the key concepts in MDX follow the link below: https://docs.microsoft.com/en-us/analysis-services/multidimensional-models/mdx/key-concepts-in-mdx-analysis-services?view=asallproducts-allversions
MDX vs SQL
In terms of MDX’s semantic model, there is less complexity as there are no relationships that need to be defined in the query. Eliminating the need for the business user to understand the data model in order to perform analysis. Where business users querying data in SQL must have a good understanding of the data model to write out these complex queries and specify the alias, aggregate type, and JOIN. Although there is more work and time involved in creating a complex query in SQL, the flexibility can be greater in SQL.
Query Syntax
MDX query syntax differs from SQL because it needs to reference coordinates and space. With Simple Queries MDX and SQL are an Apples to Apples comparison as we can see below, they both have the same number of lines to get the same query.
For example, query the sales order count of all sales that happened in 2020:
Simple Queries
SQL
SELECT COUNT(SalesOrder) as ‘Bike Sales Order Count’
FROM BikeShop
WHERE Year = 2020;
MDX
SELECT {[measures].[Sales Order Count]} ON COLUMNS
FROM [Bike Shop]
WHERE [Date].[Calendar Year].&[2020];
On complex queries we can see that many lines of SQL code are reduced to just a few in MDX, making it simple for an analyst to work with when compared to SQL.
Complex Queries
SQL
(SOURCE: Modirain [https://github.com/rsim/mondrian-olap])
SELECT SUM(unit_sales) unit_sales_sum, SUM(store_sales) store_sales_sum
FROM sales
LEFT JOIN products ON sales.product_id = products.id
LEFT JOIN product_classes ON products.product_class_id = product_classes.id
LEFT JOIN time ON sales.time_id = time.id
LEFT JOIN customers ON sales.customer_id = customers.id
WHERE time.the_year = 2010 AND time.quarter = ‘Q1’ AND customers.country = ‘USA’ AND customers.state_province = ‘CA’
GROUP BY product_classes.product_family
ORDER BY product_classes.product_family
MDX
SELECT {[Measures].[Unit Sales], [Measures].[Store Sales]} ON COLUMNS, {[Products].children} ON ROWS
FROM [Sales]
WHERE ([Time].[2010].[Q1], [Customers].[USA].[CA]);
MDX can reduce query complexity for the same business problem, which in SQL would involve many joins. Make the query easier for the analyst to work with by boiling down the same query in 9 lines of SQL to 3 lines in MDX. MDX can do this because MDX does not require the user to write any JOINS, Aliases, or Aggregation of Measures allowing users to operate at a higher level of abstraction and efficiency.
Deep Dive Into AtScale’s Query Translation
As different BI tools have different native query languages (ie. MDX, SQL, DAX) and all must communicate with a data warehouse. AtScale enables all the BI tools of your enterprise to communicate through one single source of truth. Whether it is speaking MDX, DAX, or SQL. Allowing the business user not to waste time translating query languages or figuring out how and where to create a JOIN, instead of focusing on understanding the data and creating a story from the patterns and trends.
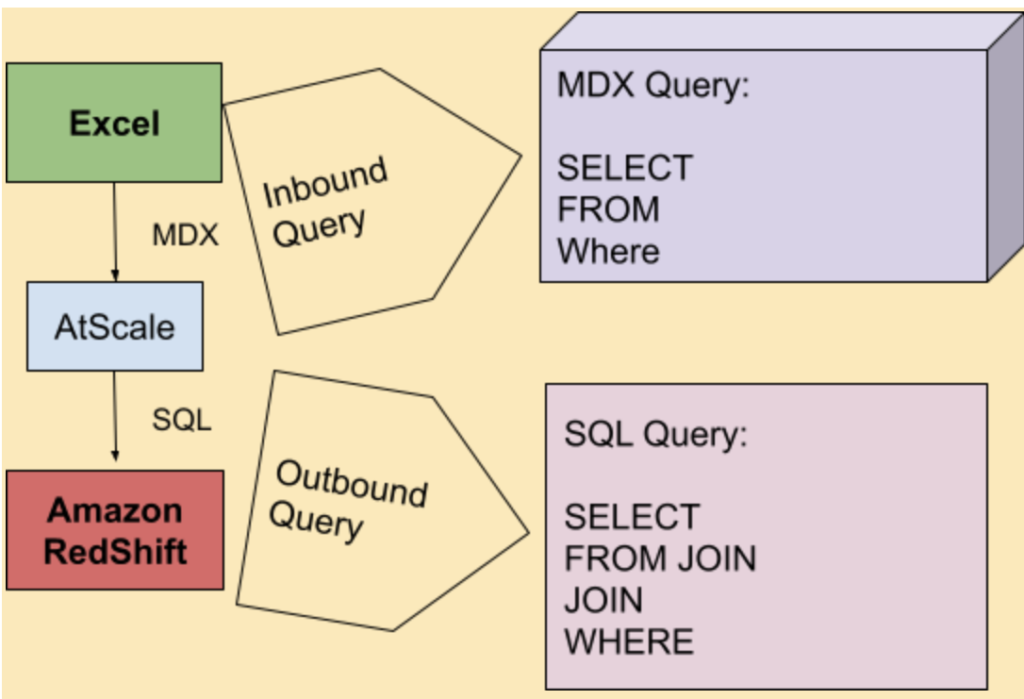
As AtScale lies between the BI tools and the data warehouses it is uniquely positioned to communicate between these different tools in your data fabric and add value to your business by making all these tools easy to use. AtScale query translation allows different BI tools (ie. Excel) which speaks MDX, to communicate with Amazon Redshift which speaks SQL.
As a BI user queries the data warehouse on Excel the MDX query is intercepted by AtScale, translated to optimized SQL for Amazon Redshift, and sent to Amazon Redshift. This process is better illustrated in the figure below.

Inside AtScale we are able to view the inbound and outbound queries from excel and see key statistics that correspond to each query.
Behind the Scenes of AtScale’s Query Tab/ From Excel Pivot-Tables to Redshift
In a production environment where a large number of queries are created by different users and for different projects, managing all these queries can be chaotic. AtScale makes inbound and outbound queries easy for the user to manage, as the user interface is very intuitive. AtScale’s ability to peek under the hood and let the user see inbound and outbound queries along with query statistics on time, user, dialect, and if any aggregates were used, is a game-changer.
To inspect the inbound and outbound queries, the user should navigate to the QUERIES tab on the top ribbon. Here the queries are displayed and the user can filter out the different queries using the filters tab, allowing for a faster query search inspection. We can see this in action when we take a look at an incoming query from Excel after we created a pivot table by filtering queries by user, and the project “Sales Insights -Redshift”. Doing this will allow the user to find the incoming query from Excel, the most recent query is located at the top of the list.
From here the user can click on the desired query and see the details of the query, including the query time, the user that queried the query, the inbound and outbound query, and more.
From the QUERIES tab in AtScale, we can see the inbound MDX query and the translated SQL query optimized for Amazon Redshift. We can also see that AtScale was able to speed up the query time by hitting an aggregate. If the user clicks on the aggregate table located in the FROM clause, they can inspect the aggregate’s information and description.
Summary
In this post, we looked at the value of Microsoft’s MDX query language for complex business problems that would be extremely complicated to do in traditional SQL. The value of dimensional analysis is that analysts do not need detailed understanding of underlying data structures when requesting a cut of summary data. Business analysts can focus on using data to answer business problems. AtScale is a unique solution for delivering dimensional analysis capabilities to Excel analysts while staying connected to live cloud data. AtScale allows the BI user to focus on what is important, finding patterns and stories with the data and leaving the rest to AtScale.


Power BI/Fabric Benchmarks