July 29, 2021
User Story: The Journey to Self-Service Data Analytics
Curated advice from 50+ data leaders, industry experts & customers
Over the last 12 months, we’ve hosted 18 webinars with 50+ industry experts, data leaders, and customers reaching an audience of 25K+ data and analytics community members/professionals.
I’ve decided to do a three-part series recapping some of the best actionable insights I’ve learned from these experts. These posts will center around three core themes that have emerged over the past year: aligning AI and BI teams to business outcomes; scaling self-service analytics and optimizing cloud analytics for scale.
Let’s dive into the first post:
How did Cardinal Health scale their data literacy programs?
For Cardinal Health, data literacy is at the core of its digital transformation strategy. They’ve built a tremendous ecosystem of tools and support to help every employee in their company achieve digital fluency. At our webinar panel on scaling data literacy in organizations, we asked Jennifer Wheeler how Cardinal Health approached its data transformation.
It starts with a commitment to learning. The company maintains three different digital education offerings via its Digital U program. Wheeler says Cardinal Health encourages all employees to begin with a 30-day digital fluency challenge, highlighting high-level concepts and digital philosophies. The next stage is digital immersion, a continuous self-directed learning environment where staff can increase their knowledge of digital topics and figure out how to bring value to their specific business cases.
Digital colleges are the capstone feature of the program, and they show the depth of Cardinal Health’s commitment to data literacy. It’s a cohort-driven learning program that helps the company address skill and role needs across the business and IT enterprise.
It’s important to remember that data literacy isn’t just about hiring the best data scientists and analysts. It’s about empowering teams in every department of the organization to bring value with data-driven decision-making.
How did General Mills deliver self-service analytics on their cloud platforms to enable more intelligent decision-making?
There’s no silver bullet for enabling self-service analytics at scale. For many companies, it means starting with their approach to data and reassessing how to leverage tools, technology, and knowledge workers to deliver value on business opportunities. When we asked Elizabeth Carrol-Anderson, Product Manager for Analytic Capabilities at General Mills, about this process, she shared some fantastic insights on the company’s data and analytics journey.
Before data became a focus at General Mills, most of its data were decentralized, resulting from disparate application transactions. They were able to make some valuable gains by centralizing their data storage into a relational database for reporting, but quickly realized that the database wouldn’t scale. So the company crafted a connected data strategy to bring all their decentralized data into a shared Hadoop platform. Teams could spend less time figuring out data transfers and integrations and more time building reusable data models and predictive analytics.
Eventually, though, Carrol-Anderson says the company reached the upper limits of the scalability in its Hadoop platform. To continue its journey to become data-driven, General Mills needed the scalability and advanced analytics that cloud platforms can offer. It also needed to break the cycle of inconsistency across its datasets, dashboards and reports.
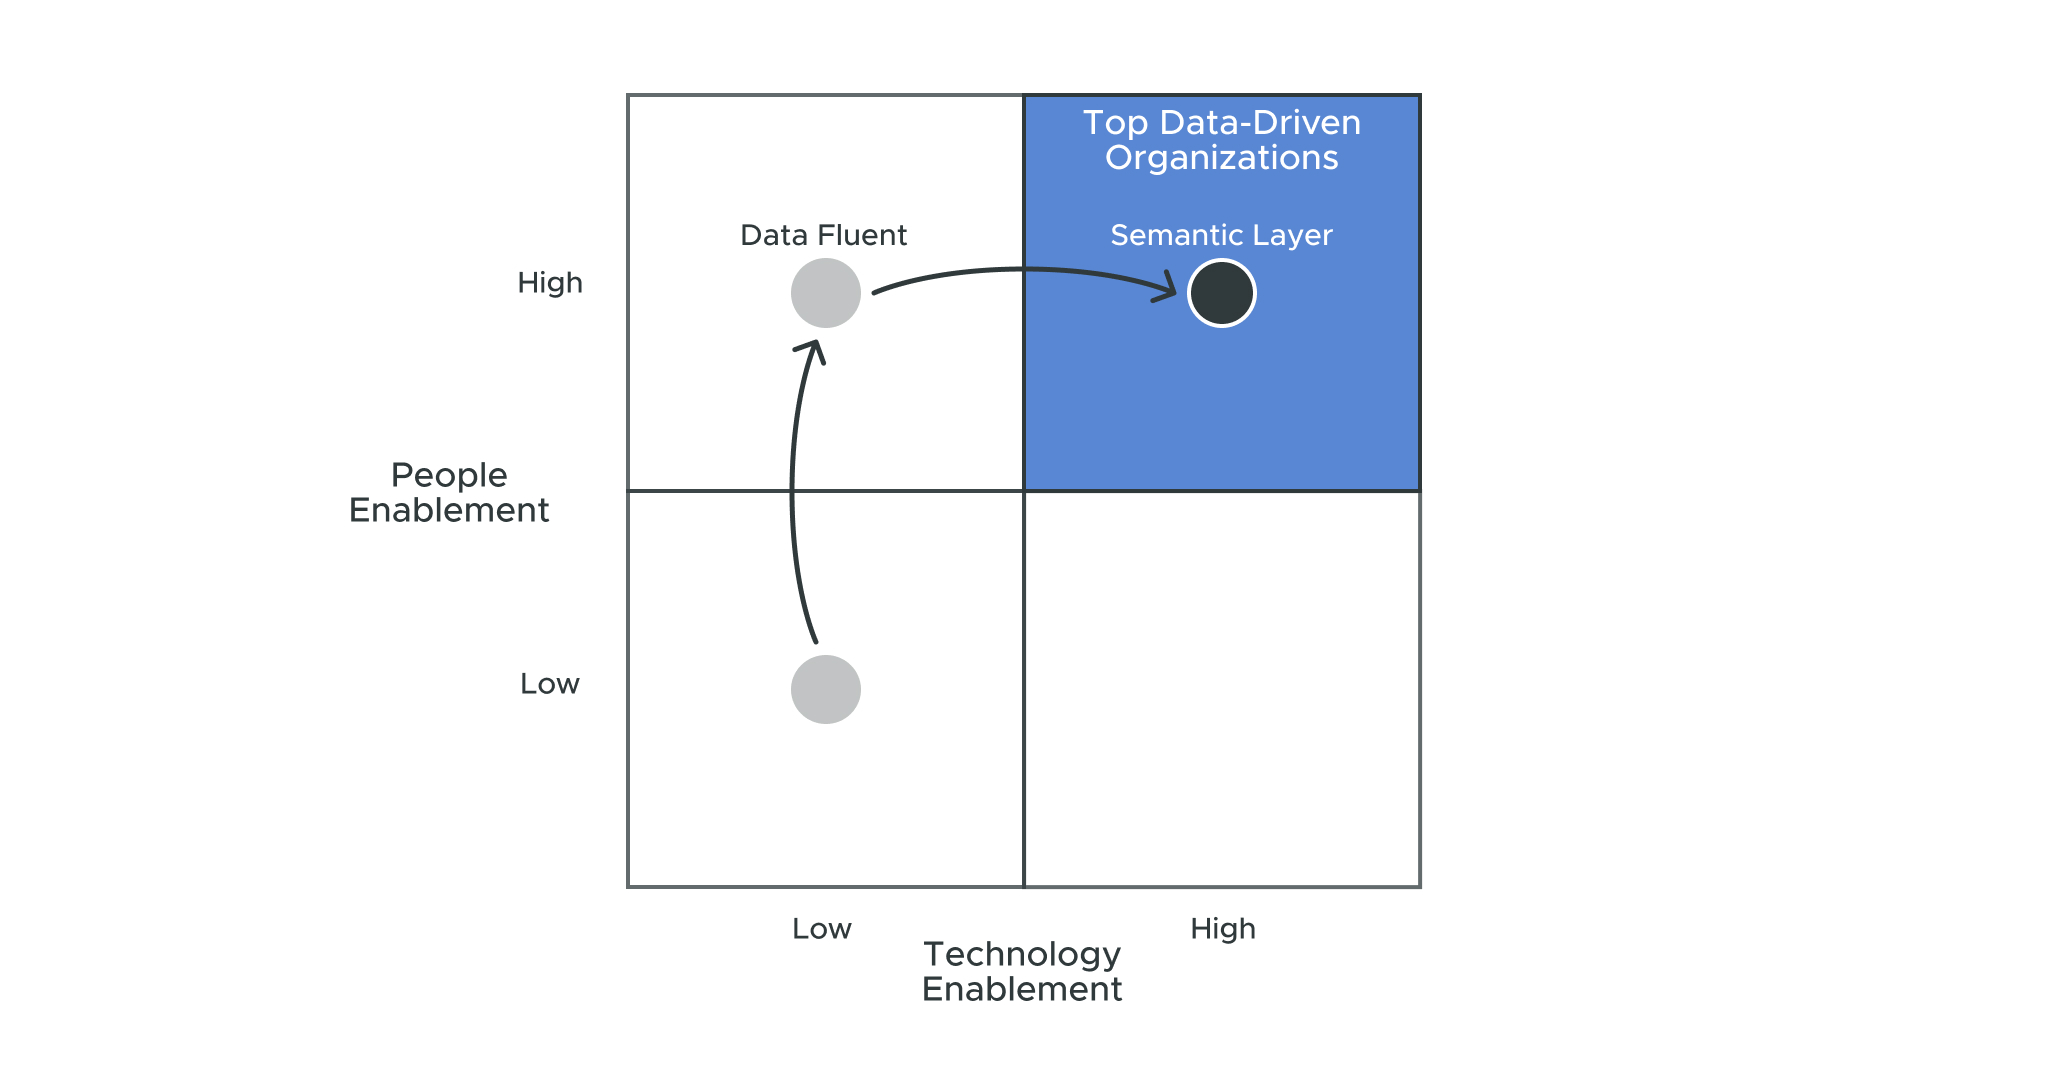
Carrol-Anderson said that a turning point for the company happened when it realized that standard definitions and a single source of truth regardless of data sources or underlying data models were the critical next step in their journey. General Mills invested in AtScale’s semantic layer to provide that single source of truth and spread data literacy across its organization.
How did Slickdeals enable data access and insights across business and functional lines?
Slickdeals is a user-driven, deal-sharing site that enables consumers to collaborate and share information for better shopping decisions. I co-hosted a webinar with Greg Mabrito, Slickdeals Director of Data and Analytics. We had a great conversation about how they use a semantic layer to solve the problem of data access for decision-makers.
Slickdeals manages many users, with over 1 billion visits annually and 12 million unique monthly users. With the sheer volume of data inherent to their business, Mabrito said that Slickdeals initially encountered several data movement, performance and scaling issues.
With their on-premises Blueshift solution, getting their data in one place was a massive weekly effort. Ten-plus hour maintenance windows and extremely fragile cube builds were tremendous barriers to enabling data access for their workers and customers. The data science work was laborious and involved serial processing of data pipelines and the results lacked cohesion and fresh insights.
To break past these barriers, Mabrito and team leveraged Snowflake with AtScale. The AtScale semantic layer helped Slickdeals establish a single source of truth, working with its Snowflake implementation and raw data to generate reusable models that helped the company deliver valuable improvements for their search and email marketing campaigns.
Stay tuned for more actionable insights from our webinar experts
That wraps up my first recap of the best insights from our 18 webinar panels. Review our webinar section to see all of the featured topics and guests. Our last post in this series will focus on industry expert insights for optimizing cloud analytics and data democratization.


Power BI/Fabric Benchmarks