April 13, 2023
Actionable Data Insights for Improved Business Results
I’ve received quite a bit of feedback since releasing our TPC Benchmark on Power BI/Direct Lake report a few weeks ago. In online forums and in conversations with customers, prospects and partners, I collected the feedback and decided to use this blog to directly address the most commonly asked questions.
Before I do that, though, it’s best to provide a bit of background for why we decided to publish the report in the first place.
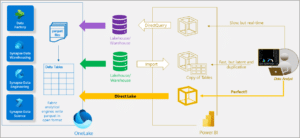
Our goal was to put Microsoft’s claim to the test that Power BI on Direct Lake was a “Perfect!” solution for delivering live, performant access to data without the drawbacks of Power BI Import Mode or Direct Query, as illustrated below (Image provided by Microsoft).

This claim seemed dubious to me. At Yahoo!, I deployed the world’s largest SQL Server Analysis Services (SSAS) cube at 24TBs in size, using Analysis Services Multidimensional Models (MD). Later, with the introduction of Analysis Services Tabular Models, Microsoft moved from an on-disk architecture to an in-memory, columnar architecture using its VertiPaq engine. There was no way I could migrate my 24TB Yahoo! MD cube into an Analysis Services Tabular cube because there was simply no way to make 24TBs “fit” into a memory-only footprint.
Given that Power BI is a superset of Analysis Services, it seemed unlikely to me that Power BI could break the scalability limitations of an in-memory architecture without a full rewrite of their VertiPaq engine. It appeared to me that the Direct Lake interface was not that, so we applied the industry standard TPC-DS benchmark to test our hypothesis using a rigorous scientific method.
What did we find? We found that the Direct Lake interface behaved as a “on-demand” or lazy data loader, with all the fundamental drawbacks and limitations of Power BI Import Mode.
To learn more, I encourage you to read the full report that documents our methodology and results. The report has sufficient detail so anyone can reproduce our results by simply following our documentation.
Below, I answered the most common questions about our methodology and results.
Q1: Did you create your data per the Direct Lake requirements?
We strictly followed the instructions as documented by Microsoft in this article to load the TPC-DS data. This entailed importing the raw TPC-DS CSV files into a Fabric Lakehouse and then using a Lakehouse notebook to create Lakehouse tables formatted with the Microsoft proprietary v-order format as illustrated in the code below:

Q2: Why did you test with such large data sizes since most Power BI customers have less than 10GB of data?
We decided to test three TPC-DS data scale sizes: 100GB, 1TB and 10TB to test the scalability of the Direct Lake interface. In the era of cloud data platforms, this hardly qualifies as “Big Data” in my opinion. In fact, I just upgraded my iCloud account to 10TB in order to handle my family’s photos and iPhone backups, so I would argue that corporate data is larger than my family’s data footprint.
However, Microsoft claims that most Power BI customers have 10GBs of data or less. It follows that since the majority of Power BI customers use Import Mode (not Direct Query) and Power BI limits imported data size to 10GB, it’s no surprise that the average customer Power BI data footprint would be less than that. It seems ludicrous to me that any organization should architect their analytics strategy to satisfy a BI tool’s limitations.
Q3: How do you know that the 1TB and 10TB tests were triggering a Fallback to Direct Query Mode?
The 1TB and 10TB test results show markedly different results than the 100GB results (in the 1TB and 10TB tests, we see up to 49% query timeouts). In order to verify that we were indeed triggering Fallback mode, we set the DirectLakeBehavior property to DirectLakeOnly as documented here, which states that “Fallback to DirectQuery mode is disabled. If data can’t be loaded into memory, an error is returned. Use this setting to determine if DAX queries fail to load data into memory, forcing an error to be returned.”
Q4: How does Fabric Capacity memory size affect performance?
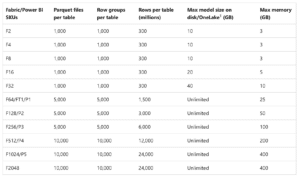
The above Microsoft documentation is actually misleading, because Direct Lake won’t fallback due to memory limitations. Rather, Direct Lake will swap columns in and out of memory once the memory capacity is hit. Instead, in our tests, Fallback mode was triggered by the rows per table limit. In the table below, you will notice that there are several table size related limits that could trigger Fallback for different capacity sizes. Notably, the top capacity tops out at 24 billion rows.

Q5: What about the “Out of Memory…” error you encountered on the F256 capacity?
When we attempted to upgrade our capacity from a F64 to a F256, we encountered the error: “You have reached the maximum allowable memory allocation for your tier. Consider upgrading to a tier with more available memory.” This was confusing to us since we did not encounter this error on a capacity size (F64) that’s 4 times smaller.
We opened a support ticket with Microsoft (#2401130010001215) and after several weeks of investigation, Microsoft support determined that since we created our semantic models on the F64 capacity, our queries were still accessing the F64 cache, even though we upgraded our capacity to F256. We were instructed that the only workaround to this issue was for us to re-create our three semantic models on the F256 capacity from scratch. We were also instructed that if we upgraded our capacity in the future, we may have to “wait for a day or so before the new capacity cores were swapped over to the new capacity”.
Since there is no way of copying a Fabric semantic model (using the Tabular Editor or SSMS will render models uneditable in the Fabric web modeler), the effort of re-creating the three models is not only extremely time consuming but error prone to boot.
Q6: Since AtScale offers a competing solution, how do we know you didn’t rig the test?
As I stated in my introduction, we documented our testing methodology in excruciating detail in the full report. Our results are fully reproducible following the process outlined in the report. Using the scientific method, we developed a hypothesis and then carefully tested it. We selected the three data sizes before the test, not after. We used an industry standard benchmark, TPC-DS, that dictates the schema and the queries. The results and charts speak for themselves.
Q7: Why is the lack of calculated column support an issue? Shouldn’t that happen upstream in the data platform or ETL?
I was a little surprised to hear this objection from multiple Microsoft MVPs. To be clear, Power BI desktop modeler has support for Calculated Columns today, while the Power BI/Direct Lake modeler does not. This is obviously a serious issue for customers looking to migrate their existing Power BI semantic models to Fabric (news flash: you can’t). This forced us to disqualify 4 out of our 20 TPC-DS queries.
However, there’s an argument that it’s bad practice to use the semantic model’s Calculated Columns feature. Instead, the argument goes, that one should embed this logic into the ETL code. I completely disagree with this approach, since it defeats the power of a semantic model’s ability to separate business logic from the physical data. In our case, the calculated columns were required for creating tiers (or tiles), something that can clearly change fairly often and should never be encased in ETL code.
Given that Fabric semantic models do not allow for the sharing of dimensions or calculations across multiple models, I can see how this may be an issue for the Power BI modeling tool, but not for a modeling tool that supports a library of semantic objects.
Q8: Are you going to run the benchmark on data platforms other than Snowflake?
Yes, we intend to also benchmark other cloud data platforms, not just Snowflake. Stay tuned!
Further Thoughts
I want to thank everyone for their questions and feedback. Our intention is to make our testing methodology and results as transparent and independent as possible. So, please, keep your questions coming. We intend to update our results as Microsoft continues to improve Fabric.
How Does Power BI / Direct Lake Perform & Scale on Microsoft Fabric