The use of data aggregations (i.e. aggregates) to accelerate query performance is a common practice for data engineering teams, but the question remains how to balance resources like time and compute consumption in the aggregation process. Rather than relying on manual data engineering, AtScale accelerates analytics query performance using a novel combination of autonomous aggregate management and graph-based query optimization.
This approach allows the AtScale platform to harness the power of modern cloud data platforms (e.g. Snowflake, Google BigQuery, Amazon Redshift, Azure Synapse, Databricks) to improve the performance of business intelligence tools (e.g. Tableau, Power BI, Looker, Excel) while minimizing overall compute consumption.
To better handle aggregate management, AtScale leverages four approaches that incorporate both autonomous and human assisted. approaches.Below, this post will explore the basics of AtScale’s aggregate management with insight into how this capability works within the AtScale platform to optimize query performance.
Aggregate Types
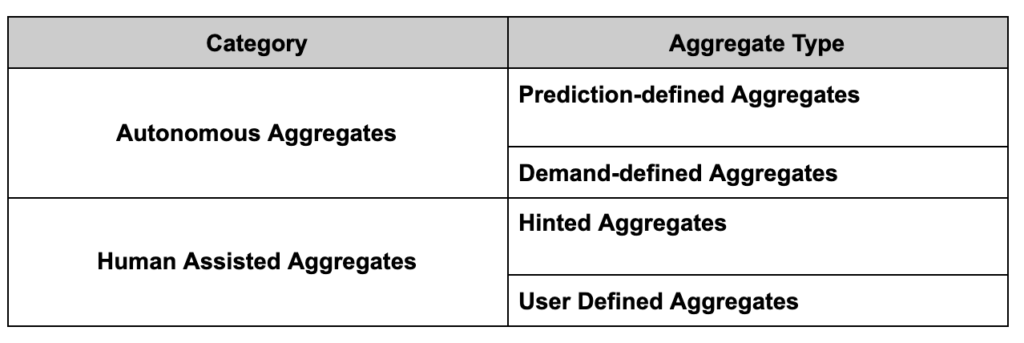
We think about four basic types of aggregates within two categories:
Understanding the basics of each aggregate type allows users to leverage the full capabilities of AtScale and identify opportunities to further optimize performance.
Prediction-defined Aggregates (Autonomous)
As the name suggests, the way prediction-defined aggregates work is that the AtScale engine predicts when an aggregation may improve query performance by computing table statistics at model design time.
Prediction-defined aggregates then leverage these statistics, and, more importantly, the data relationships as defined by the AtScale semantic model to determine if and when to compute an aggregate before any user queries are observed.
These prediction-defined aggregates then can provide a starting point for accelerating query performance. By working autonomously and off a prediction-based model, these aggregations help apply data to model out your future.
Demand-defined Aggregates (Autonomous)
Like prediction-defined aggregates, demand-defined aggregates are automatically generated by the AtScale engine. In contrast to prediction-defined aggregates, AtScale will compute demand-defined aggregates in response to user query patterns.
As users begin to query data via the AtScale semantic layer platform, AtScale detects query patterns and assesses whether to compute an aggregate, alter an existing aggregate, or drop a related aggregate to make room for higher valued aggregates.
These demand-defined aggregates operate off your use and query patterns, making them a responsive and autonomous tool flexible enough to adapt to your needs.
Hinted Aggregates (Human Assisted)
While defining the AtScale data model, the AtScale modeler can choose to mark certain data model objects (dimensions, measures, keys, query data sets) with “hints.” For hinted aggregates, the AtScale engine will use these hints to determine whether to materialize virtual relationships to improve performance.
These hinted aggregates require human assistance, but allow users to flag and mark information they find most relevant, empowering the AtScale modeler to not only keep track of their learnings but to apply them as well.
User-Defined Aggregates (Human Assisted)
If the data modeler anticipates that an aggregate will be useful immediately, the modeler can define a user-defined aggregate and attach it to the data model. Then, upon publishing the data model, the AtScale engine will immediately materialize the aggregate rather than waiting to observe user query behavior.
These user-defined aggregates are especially useful for accelerating exact distinct count metrics which are typically very resource intensive for most data platforms. By applying human assistance, the AtScale engine can operate far more efficiently for you and your business.
To create a new user-defined aggregate in the AtScale platform, navigate to the PROJECTS tab on the top ribbon, select a Model to work from and navigate to the MODEL CANVAS. Here the user can select the “User Defined Aggregate Tool” button represented by the two arrows pointing at each other on the tab list on the right.
From here the AtScale modeler can define the aggregate by selecting the dimensions. In our case, we selected “Calendar Year” as our dimension and “Raw Cookie Count” as our measure.
Managing Aggregates
In addition to the four basic types of aggregates, there are several common aggregate management tasks which we will summarize below.
Training Mode
The AtScale platform will create and manage aggregates in response to user query patterns. By enabling Training Mode in AtScale Design Center, modelers can trigger the creation of demand-based aggregates without having to wait for users to interact with the model first.
In layman’s terms, training mode allows users to train the AtScale platform to a specific set of query patterns, empowering them to calibrate the platform to their needs in a clear and transparent way
After training mode has been enabled in AtScale Design Center, the AtScale modeler should refresh their dashboards and reports to trigger the AtScale platform to build aggregates. Enabling and disabling AtScale’s training mode is done at a per-user level by navigating to the user profile page and to the right of the page as shown below.
The logic for AtScale’s training mode is better illustrated through the decision tree below. When training mode is enabled, the AtScale platform will not run the raw queries. Rather, it will evaluate whether it should create an aggregate.
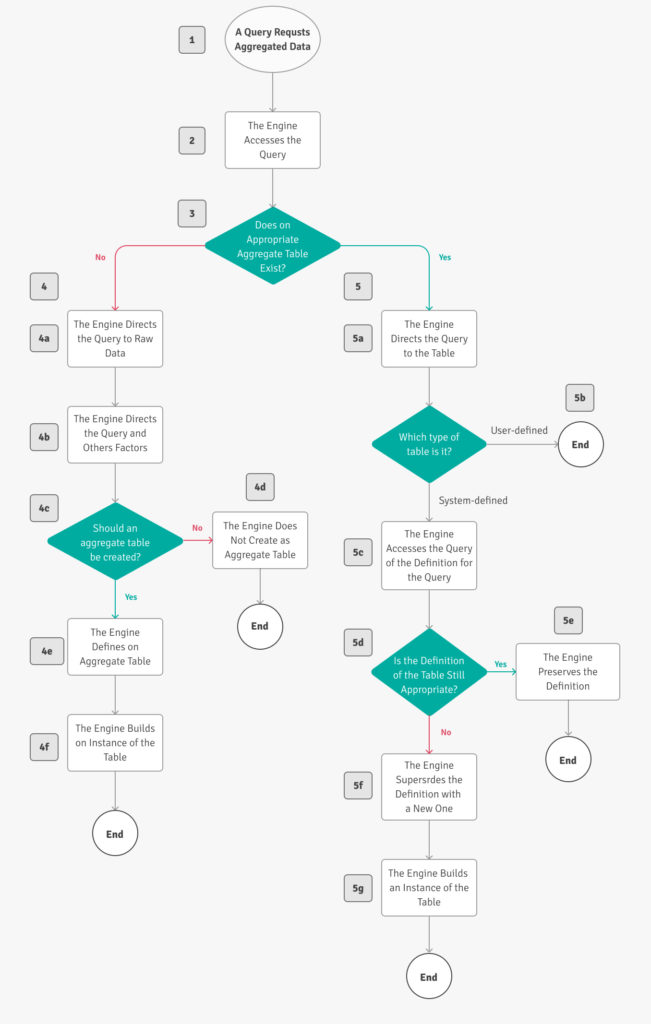
To see more information on the actions taken for each query see the documentation page below: https://documentation.atscale.com/container/atscale
Finding Queries and Aggregates Through AtScale
In a production environment, a large number of aggregates and queries are generated and captured. To better facilitate users, the AtScale Design Center provides tools to allow users to filter both these queries and aggregates and allows them to examine their details. The AtScale Design Center user can view aggregate details via the top ribbon’s “Aggregates” tab and filter them by type, project, model and more.
The AtScale Design Center provides similar tools for examining the queries that the AtScale platform processes. Users are able to access these end user queries by navigating from the top ribbon to the “Queries” tab. These queries can then be filtered by user type, user id, query id, projects, model and more to offer not only transparency but ease-of-use for assembling and sourcing the data you need.
Updating Aggregates
Since the raw, underlying data is constantly changing, it is essential to update the aggregates as well. There are four methods for triggering an AtScale aggregate update process:
- Schedule – AtScale aggregates will be updated on a time-based frequency defined in AtScale Design Center.
- REST API – A program or process can call an AtScale REST endpoint to trigger an aggregate update.
- Trigger File – A program or process can drop a file in a specified location that the AtScale platform is watching to trigger an aggregate update.
- Manual – A user can manually trigger an aggregate update in AtScale Design Center.
If the user navigates to the aggregates tab they can see how the different types of aggregates are being refreshed with new data.
Incremental Aggregate Builds
Incremental aggregate updates allows AtScale to use a time-based bookmark to keep track of the last data update point in time. The incremental indicator field enables AtScale to update the aggregate where it left off in the process without duplicating data to ensure the freshest information without an excessive churn of resources
As you can see below, we can create a computed column with the unix timestamp of txn_time to create an incremental indicator field to use for incremental aggregate updates.
After defining an incremental indicator field, the Design Center user can then navigate to the bottom of the Edit a Dataset window, enable the ‘incremental builds” toggle and select the newly created computed column. This will enable incremental aggregate updates for any aggregates associated with this dataset.
General Settings
There are several other levers users can adjust to control how AtScale manages aggregates. For example, the AtScale Design Center aggregate general settings screen allows users to adjust the retention limit per cube to control the total number of aggregates AtScale will create.
Summary
Powered by a data model, the AtScale platform applies machine learning and graph-based query analysis to optimize query performance and minimize costs for a variety of cloud data platforms.
Replicating this level of sophistication through manual data engineering can be costly, time consuming and impractical to manage. However, by applying the AtScale platform to autonomously manage the end user query experience you can optimize your data aggregation to save time and resources, empowering your data engineers to spend their time on creating business value with your data instead of wrangling it.
SHARE
The Practical Guide to Using a Semantic Layer for Data & Analytics