July 13, 2023
The 6 Principles of Modern Data Architecture
In the fifteen years since Tableau was founded, it has emerged as one of the preeminent business intelligence software tools, to the extent that only Microsoft Excel is utilized by more enterprises to analyze data. Tableau’s popularity stems in many ways from its versatility. The tool allows users to combine data from different sources to produce reports that are in turn utilized to answer critical business questions. Tableau’s use cases span most industries, as well as most departments within a company. For example, a retail organization might have multiple teams employing Tableau to look at both sales data and core financial metrics, while a manufacturing firm might use the software to look at support and inventory data.
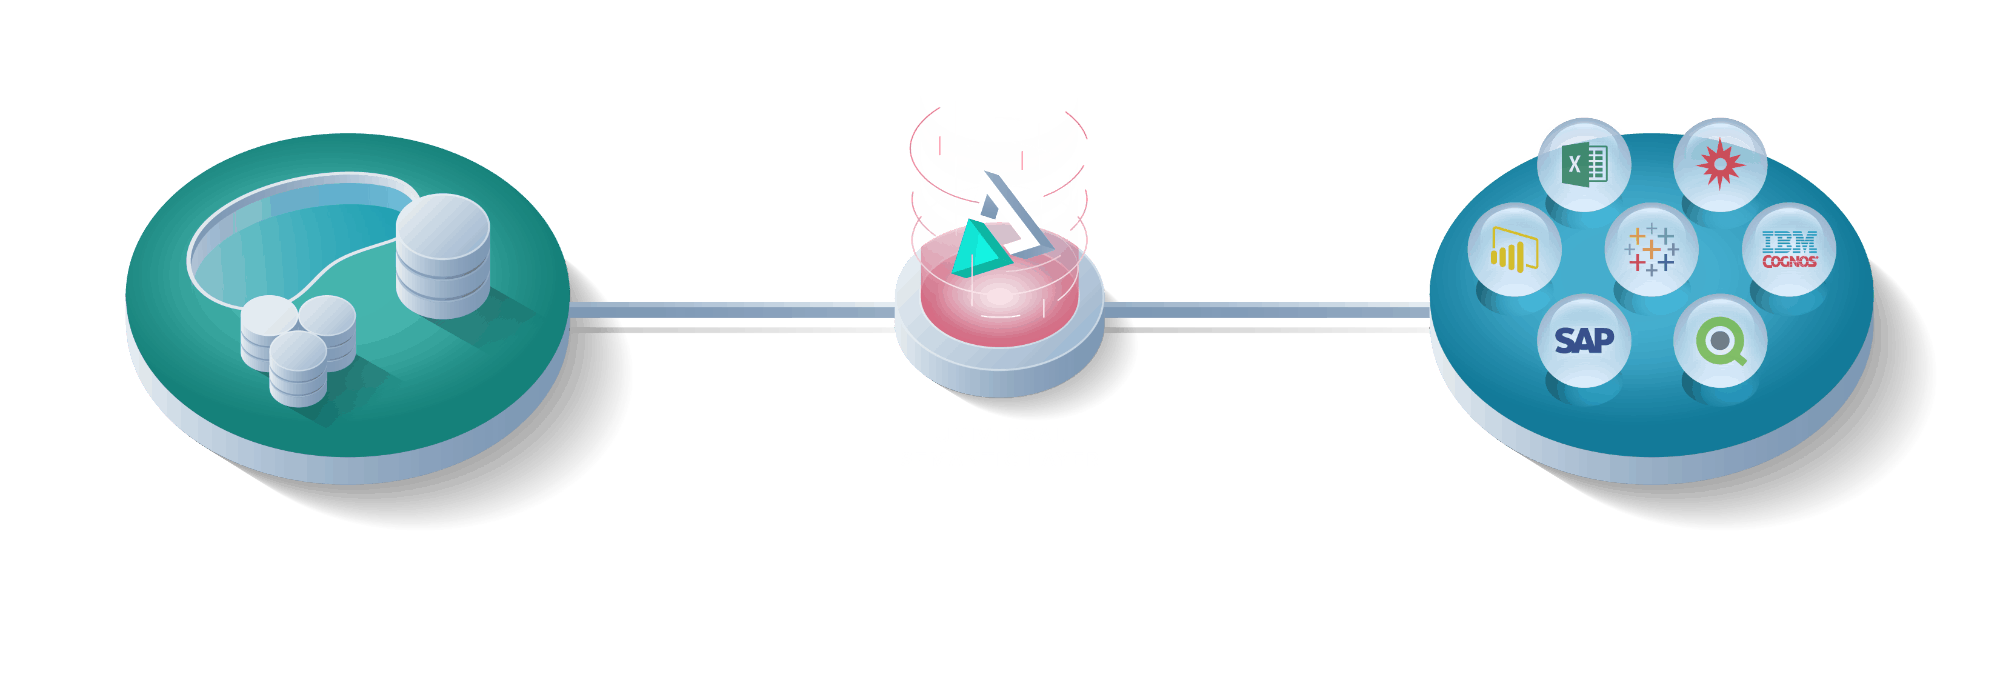
While Tableau is a highly powerful tool in an enterprise’s toolbelt, there are often areas where Tableau can struggle. Large datasets can slow Tableau’s query response time to a crawl. Pulling in data from different data stores can result in confusion as to which column from which table in a data store actually represents the value that a user is trying to use in a report. Finally, enterprises’ increasing preference towards moving data into cloud warehouses can require rewriting how Tableau is configured in an organization, a process that is both interruptive and costly. Fortunately, all three of these performance challenges are eminently fixable through the use of an intelligent data fabric that sits between Tableau and the data warehouse that it analyzes data from — I’ll discuss the versatility of an intelligent data fabric one challenge at a time:

1.) Large Datasets
Even though Tableau has only existed for 15 years, the preferred method in which organizations store their data has changed a few times during that span. In the early 2000s, data warehouses like Teradata maintained a dominant market position, but over time, Apache Hadoop and cloud data warehouses like Amazon Redshift, Google Big Query and Snowflake have emerged as alternatives. What all three types of data stores have in common is that they can store petabytes of data, a capacity that has become necessary as enterprises accumulate more and more information. While Tableau is able to query these data warehouses, the performance of queries to massive quantities of raw data tends to be suboptimal. If Tableau has to scan billions of rows of raw data, a fairly straightforward query can take hours or even days to execute. This problem is exacerbated when many users are attempting to query the same dataset simultaneously — an issue known as query concurrency.
How Data Fabric Helps With Large Data Sets
Employing an intelligent data fabric between Tableau and the data warehouse it is querying is one method of solving the challenge that large data sets present to a robust Tableau implementation. A data fabric can aggregate information pulled in previous queries so that Tableau scans an aggregate table instead of the raw data on the backend. Allowing queries to hit smaller data sets than if they needed to scan an entire warehouse worth of raw data also alleviates the issue of many concurrent queries, due to the faster speed of each individual query. By removing the primary causes of slow time to insight (raw table scans and query concurrency), an intelligent data fabric can reduce query response time from days to minutes, enabling businesses to act on critical questions with rapid efficiency.
2.) Confusing Columns
Imagine you are a business intelligence analyst at a global retailer and are tasked with comparing sales data from stores in different geographies. Tableau is a perfect tool for this type of comparison. However, a problem emerges when the data from the eastern United States is stored in a separate table than the data from western South America. Perhaps the South American operations were acquired through an acquisition, and that company already had an existing data structure, or perhaps that business unit implemented their schema separately from what other parts of the company used. Regardless of the cause, the effect is that you as a BI user may need to wade through columns dealing with sales that all sound very similar, such as sales_amt, sales_total, sales_ord, and sales_$$, without a clear understanding of which truly represents total sales from each distinct region.
How Data Fabric Helps With Confusing Columns
Again, an intelligent data fabric that sits between Tableau and a data warehouse can clean up the confusion around which columns represent what data points. By obfuscating the raw data from Tableau, a data fabric layer enables a data architect to combine data from different areas into a single business-centric data model. As a result, all of the potentially confusing columns can get cleaned up into a single source of truth that is easy for BI to users to pull and utilize within Tableau. In general, an intelligent data fabric can do the heavy lifting of summarizing complex data as simple measures and dimensions that all Tableau users can easily interpret and use to answer key business questions — such as assessing sales data from an organization’s disparate regions.
3.) Moving Data on the Backend
While the legacy platforms and emerging technologies that Tableau analyzes data from are all able to store vast quantities of information, there are many differences between them that might cause an organization to move from one warehouse to another. For example, the emergence of Hadoop enabled enterprises to store the massive amounts of data they had accumulated for far less than it would cost to host that data in an on-premise warehouse like Teradata or Netezza. However, Hadoop itself has been challenged by cloud platforms such as Google BigQuery, Amazon Redshift, and Snowflake. These platforms can be more cost effective than Hadoop, and are generally much easier to maintain. As a result, most large enterprises have a cloud transformation strategy underway, but actually executing that strategy without interrupting how Tableau users operate is a major challenge. Since Tableau connects to data differently depending on where that data gets pulled from, moving data on the backend requires rewriting the data model to align with the new data store. This time-consuming and arduous process can significantly hinder a business’ ability to effectively report on critical business challenges, such as identifying the cause of an inventory shortage of a certain product.
How Data Fabric Helps With Moving Data on the Backend
Perhaps the most important long-term use of an intelligent data fabric is that it minimizes business interruption for Tableau users when enterprises move data between backend warehouses. Since intelligent data fabrics contain a business-centric data model, they can be repointed to wherever data is moved to. This is a vital function, as it will allow Chief Data Officers to feel comfortable that they can realize the cost savings and performance benefits of moving to a modern enterprise data warehouse without compromising Tableau users’ ability to rapidly produce business critical reports. Indeed, when the next innovation in data warehousing inevitable emerges, intelligent data fabrics will be immense in enabling enterprises to seamlessly move to the warehouses of the future while maintaining smooth operations in Tableau.
Getting the most out of Tableau with AtScale’s Data Fabric
Tableau has established itself as a vital cog in many enterprises’ core business operations. Along with Microsoft Excel, it is the most common tool used to distill the vast quantities of data that companies collect into meaningful insights about an organization’s primary challenges. Using an Intelligent Data Fabric like AtScale’s boosts the power of Tableau by solving some of the key challenges that users of the tool run into when it is connected to an enterprise data warehouse.
Download this datasheet to learn more about how AtScale improves Tableau performance, regardless of whether data is stored in an on-premise system such as Hadoop, or in a cloud data warehouse like Google BigQuery or Snowflake.


NEW BOOK