March 11, 2020
How to Learn More about AtScale and Google BigQuery
Let’s talk about the results. In our most recent webinar with bol.com, Maurice Lacroix, BI Project Owner of bol.com and I shared how Maurice and his team are increasing the ROI in their Google BigQuery investment while boosting their BI performance. In this blog post, I share the details behind the numbers.
This first chart shows you two different runs of the TPC-DS benchmark. In this webinar, Maurice talked a lot about managing costs. In this chart, what you see is the total minutes for running all the queries in the TPC-DS benchmark.
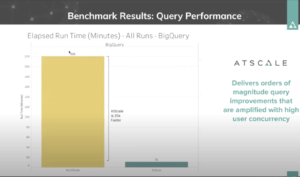
Google BigQuery alone took 220 minutes to compute those queries whereas AtScale took only 11 minutes. That right there is 20 times faster, which is important because you want to give your users much more interactive speeds. AtScale can do that. Google BigQuery is already a very good data warehouse and Maurice made a great choice with it. It’s already very fast, but it’s not fast enough for BI style queries that require sub-second response times. And that’s exactly where AtScale can help.
In this next chart, you’ll see the performance difference again without AtScale and with AtScale for different query load scenarios. We ran 4 groups of tests: a single thread, five concurrent threads, 25 concurrent threads, and then 50 concurrent threads. You’ll notice that without AtScale, each increase in threads results in a roughly linear increase in query time. For example, once you go from five to 25, it’s about five times longer. And then from 25 to 50, it’s two times longer. So as your BigQuery usage grows, your query times are going to take proportionately longer. That’s not the kind of chart that you want to see.
What you want to see is you want to see what you see below.
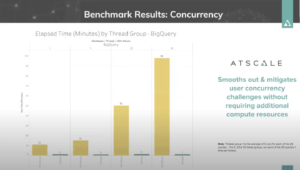
With AtScale, you can see that there’s almost no change in the time it takes to run those queries even under significant concurrent query load.
For looking at cost, we ran our numbers for Google BigQuery’s two different pricing models.
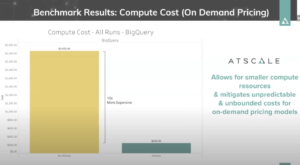
On- Demand Pricing: This is the total cost it took to run the TPC-DS benchmark tests. It took $2,455.00 to run without AtScale, versus $243.00 with AtScale.The AtScale cost includes aggregation compute time.
As you can see, it’s ten times more expensive to run the TPC-DS model on BigQuery with the on-demand pricing. This is the pay as you go, the $5 per terabyte read pricing model.
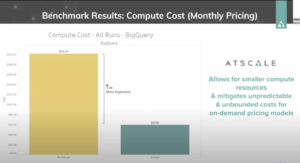
Slot-Based (Monthly) Pricing: This is the pricing model that Maurice, and bol.com deploy. You can see that it is much less expensive here, because it’s based on time, not data read. In this pricing model, the time it took to run the benchmark with AtScale is almost three and a half times faster or three and a half times less expensive because we’re making Google BigQuery work less. Of course, if you’re willing to spend $40,000 a month for slot slot-based pricing, that’s $10,000 for every 500 slots, you could see that, over time, it’s going to be much cheaper to use the fixed rate, monthly pricing pricing model. It is also more predictable, but if you don’t have $40,000 per month to spend on Big Query, you’re going to want to go with the on-demand pricing model.
In this two-part demonstration, I show you how to build a virtual cube and how AtScale is running live queries on a TPC-DS 10 TB data warehouse.
Related Reading:
- Watch our webinar on-demand.
- Read our webinar recap, “Bol.com and Google BigQuery: The Journey, Performance and Cost”
- Download our data sheet today to learn more on Google-BigQuery with AtScale
- Watch the AtScale Office Hours: Benchmark Analysis on Google BigQuery on-demand webinar
- Read the AtScale Cloud Data Warehouse Benchmark: Google BigQuery report


BENCHMARK REPORTS