Many companies struggle with making data available rapidly, while structuring and integrating this data effectively to enable the creation of actionable business intelligence insights and analytics. With an ever-increasing amount of data available via modern data platforms, companies need to ensure that their data is available, accurate, actionable and automated (including for self-service BI). This blog reviews the current challenges with making data available and actionable and discusses the new capabilities available for AtScale to accelerate becoming smarter, faster.
A Smarter, Faster Path to Business Intelligence
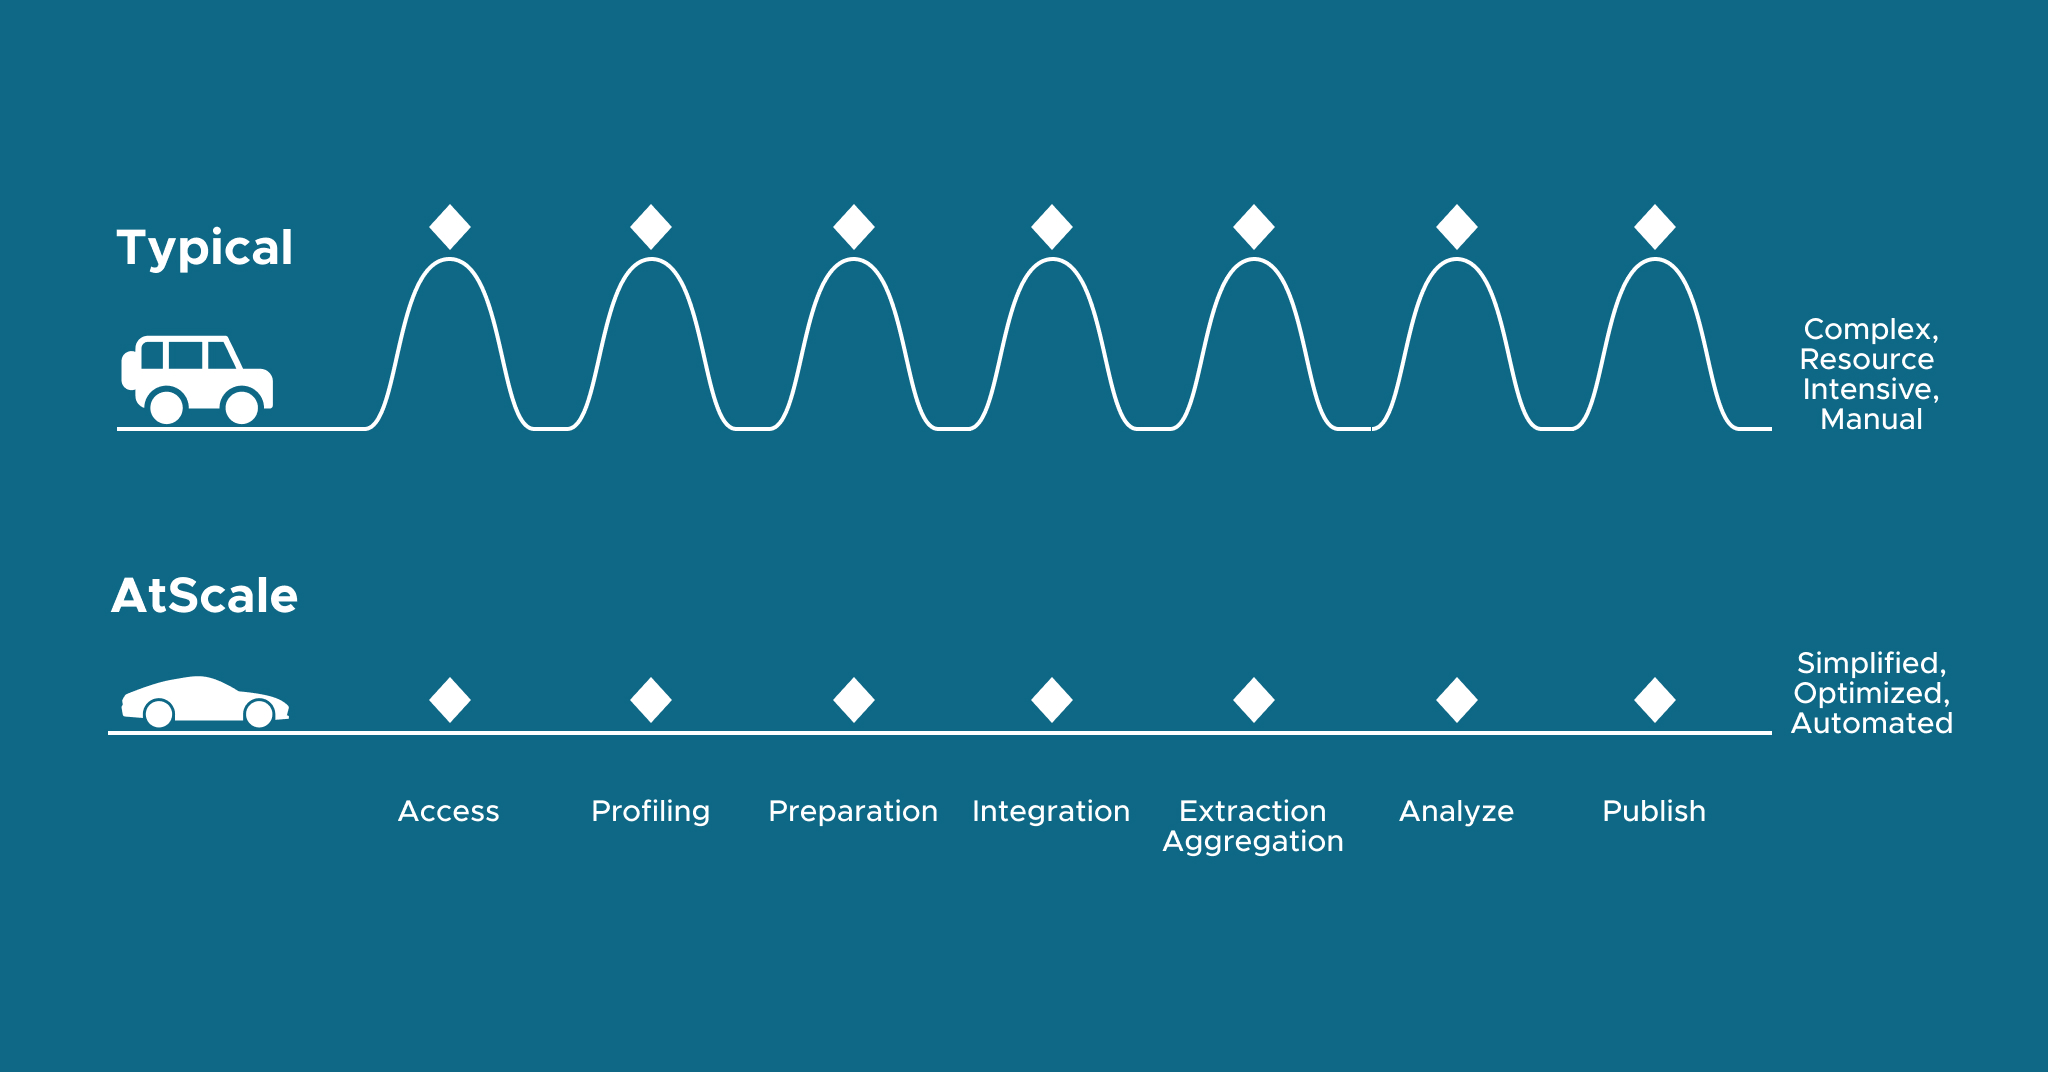
As companies move to modern cloud platforms to enable the improved use of data, insights and analytics, many realize that the “last mile” of preparing, analyzing and publishing insights – the data consumption layer for business intelligence – takes too long to create, refresh and refine. Why? There are three key reasons:
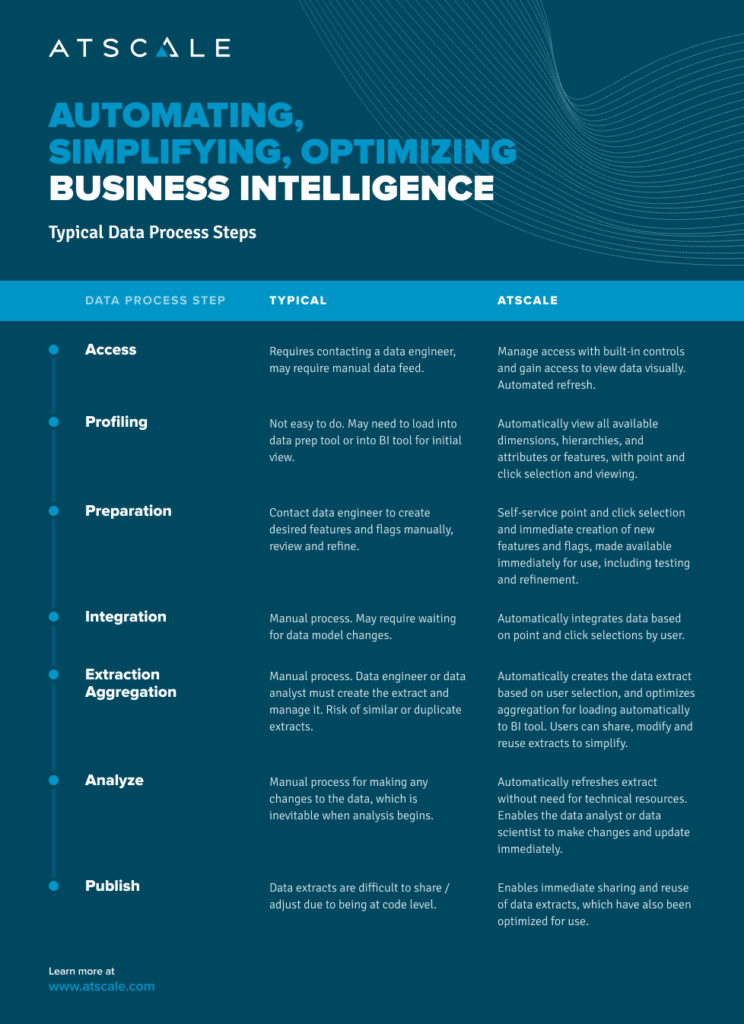
1. Complexity: Preparing data for business intelligence requires as many as seven steps, which include accessing, profiling, structuring, integrating, aggregating, analyzing, and publishing data.
2. Resource Intensity: Making data available for analysis often requires many different resources and hand-offs. For example, data engineers may be needed to make the data available, data modelers to create changes to dimensions, hierarchies and attributes or features, data engineers to build extracts and aggregations, data analysts to review and make refinements along the way, and data analysts or BI engineers to build individual reports within a BI tool. And each time there is a change, a set of resources needs to be engaged and delays can occur because workloads may be high, and lead-times short.
3. Manual Coding: The process for making data available is manual, with each step requiring some level of coding, which means that it has to be done with a technical resource, This also needs to be continually operated and maintained. Over time, as companies realize the value of having more data available, the lack of automation can create tremendous technical workload overhead to manage.
Automating, Simplifying, and Optimizing Data for Business Intelligence
AtScale has created a solution that automates and simplifies the process for making data available for business intelligence, including to BI tools like Tableau, Power BI and Excel. Thus, one user, whether they’re a data analyst or data engineer, can visually select the dimensions, hierarchies and attributes or features desired. Then, AtScale automatically creates the data extract for loading the data into the BI tool immediately. Further, given that many BI tools cannot handle atomic-level data, AtScale automatically optimizes the aggregation of the data to ensure that reports generated within BI tools are effective.
Let’s look at how AtScale automates the data and process for business intelligence.
The Path to Smarter, Faster Business Intelligence – AtScale Automation
AtScale’s semantic layer platform simplifies and optimizes data made available for business intelligence. The solution makes it easy for a data analyst, data scientist or data engineer to visually create virtual data extracts for BI tools automatically, without the need for manual coding and no physical data movement. Further, these views of data can be governed, shared and refined collectively, thus creating a faster path to business intelligence insights that is code-free and productive.
The Key to Business Intelligence Automation – AtScale Semantic Layer
AtScale’s semantic layer is uniquely positioned to support business intelligence automation – the ability to visually view data, including attributes, metrics and features in dimensional form, clean it, edit it, refine it by adding additional features, and have it automatically extracted and made available to any BI tool, whether it’s Tableau, Power BI or Excel. Moreover, this only requires one resource who understands the data and how it is to be analyzed, eliminating the need for complexity and resource intensity. This approach to business intelligence automation also eliminates multiple data hand-offs, manual coding, the risk of duplicate extracts and suboptimal query performance.
SHARE
Case Study: Vodafone Portugal Modernizes Data Analytics